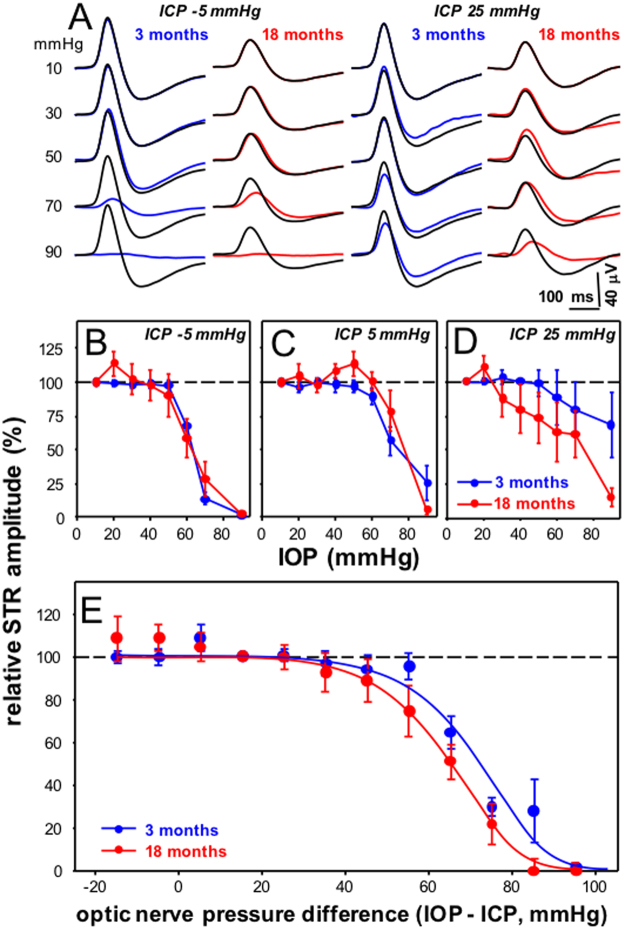
Figure 1.
Effect of IOP and ICP modification on ganglion cell function in 3 and 18 month old rats. (A) Group average STR waveforms for young (3 month, blue traces) and older rat eyes (18 months, red traces) in response to increasing IOP at ICP of −5 and 25 mmHg. (B–D). Group average (±SEM) normalized STR amplitude for young and older eyes as a function of IOP at ICP −5 mmHg (B, 3 month n = 6, 18 month n = 7) ICP 5 mmHg (C, 3 month n = 9, 18 month n = 7) and ICP 25 mmHg (D, 3 month n = 5, 18 month n = 6). (E) All data from panels B-D combined and plotted as a function of the optic nerve pressure difference (ONPD = IOP – ICP, mmHg). Lines indicate dose response curve fits to 3 and 18 month old data.

