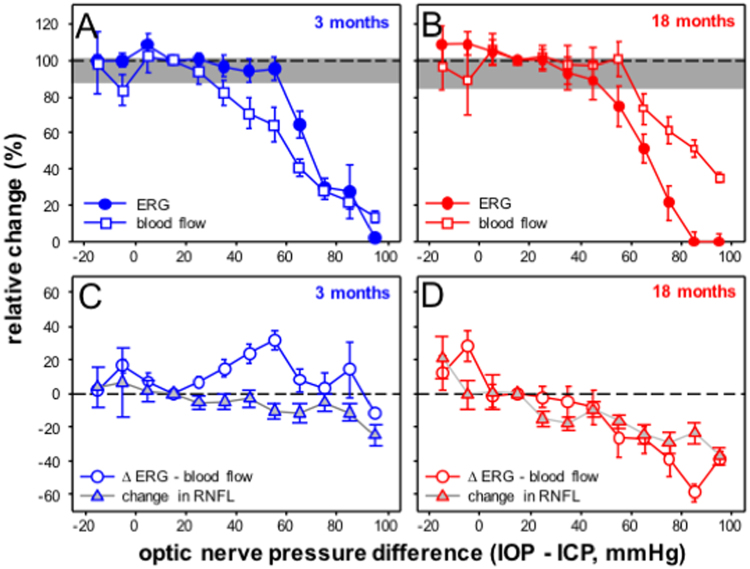
Figure 5.
Comparisons between structure, function and blood flow across a range of optic nerve pressure differences (IOP - ICP, mmHg) in 3 and 18 month old rats. Group averaged ganglion cell function (filled circles) is overlaid on blood flow (unfilled squares) for 3 (A) and 18 month old groups (B). Grey area indicates the 95% confidence limits derived from all young and older eyes at baseline. Group averaged residuals (ERG – blood flow %, unfilled circles) are compared with % change in RNFL thickness (grey triangles) for 3 (C) and 18 month old groups (D).

