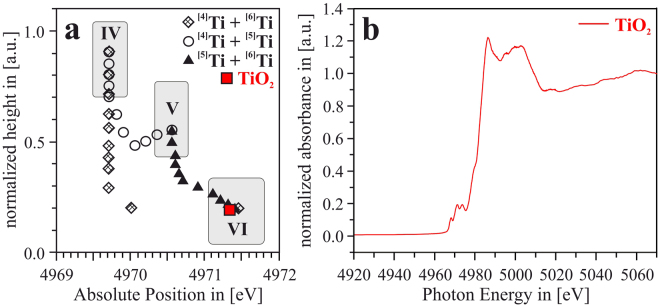
Figure 2.
(a) Representation of normalized height vs. absolute energetic position of the Ti-K pre-peak. The grey areas indicate which combination of absolute position and normalized height is indicative for [4]Ti, [5]Ti and [6]Ti. [redrawn from ref.29]. The triangles, squares and diamonds show predicted normalized height vs. absolute position – values for compositions of [4]Ti + [6]Ti, [4]Ti + [5]Ti, [5]Ti + [6]Ti with different ratios of the respective composition [see ref.29]. The analyzed TiO2 powder standard is apparently 6-fold coordinated, as expected. (b) Spectrum of the TiO2 powder reference, the average absorption coefficient for energies greater than 5050 eV is set as “1”, and the spectral data is normalized to that value.

