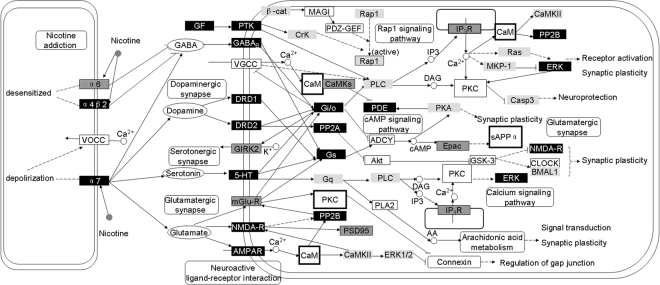
Figure 2.
A systematic network of the molecular mechanism underlying schizophrenia and nicotine addiction. This network was built based on the results of pathway analysis and network analysis. Nodes shown in white, grey, and black rectangles represent genes related to schizophrenia, nicotine addiction, or both diseases, respectively. The predicted candidate genes are shown by larger rectangles with bold border. Ellipses represent neurotransmitters like GABA, serotonin, dopamine and glutamate. Dashed and solid lines represent indirect and direct regulations; lines with arrow and spot represent activation and inhibition, respectively.

