Figure 7.
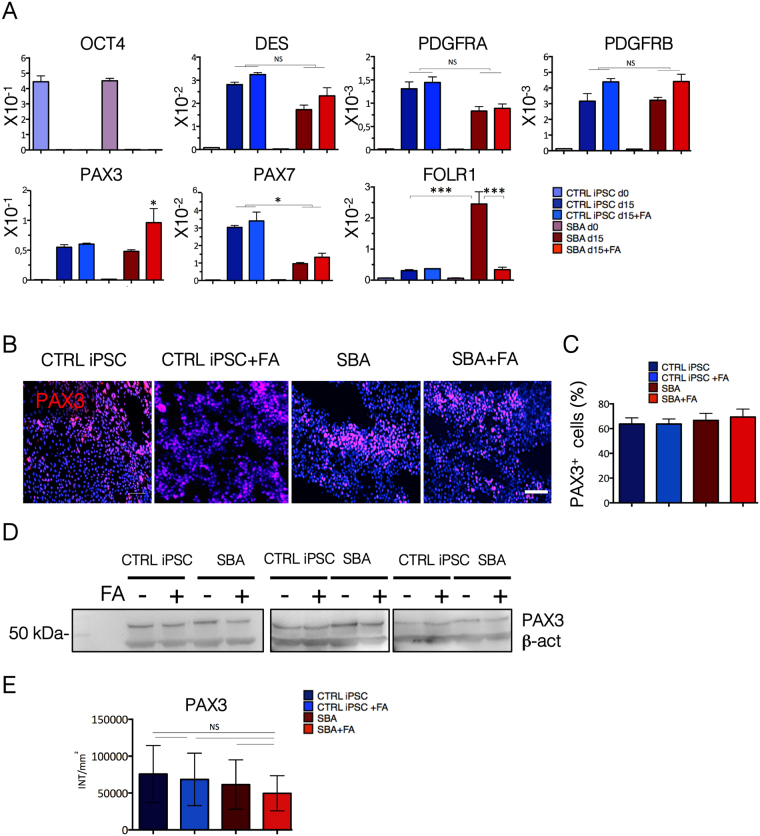
Early myogenic commitment of SBA iPSC lines. (A) qRT-PCR data of CTRL iPSC and SBA lines for pluripotency (OCT4), mesodermal (DES, PDGFRA, PDGFRB), early myogenic (PAX3, PAX7) and folate receptor 1 (FOLR1) genes at day 0 and day 15 of myogenic differentiation presented as relative expression to housekeeping gene GAPDH. NS, not significant. Data are plotted as average ± SEM. *P < 0.05 SBA d15 vs SBA d15 + FA, CTRL iPSC d15 vs SBA d15 + FA and CTRL iPSC d15 + FA vs SBA d15 + FA (PAX3), *P < 0.05 CTRL iPSC d15 vs SBA d15, CTRL iPSC + FA d15 vs SBA + FA d15 (PAX7), ***P < 0.001 CTRL iPSC d15 vs SBA d15, SBA d15 vs SBA + FA d15 (FOLR1). N = 4 independent experiment per iPSC line. (B) IF staining for PAX3 (red) in CTRL iPSCs and SBA-derived myogenic progenitors at day 15 of myogenic induction. Representative images of CTRL1#2 and SBA2#1 are shown. Nuclei were counterstained with DAPI (blue). Scale bar = 100 μm. (C) Enumeration of PAX3 + cells in CTRL iPSC and SBA lines at day 15 of myogenic induction shown as percentage. Data are plotted as average ± SEM. N = 4 independent experiment per line. (D) WB analysis for PAX3 protein (53 kDa) in CTRL iPSCs and-derived myogenic progenitors. Housekeeping protein β Actin (45 kDA) used as an internal control. The images were cropped on the black lines. Full images of gels/blots can be found in Supplementary Fig. S7. (E) Enumeration of PAX3 protein using QuantityOne Software. NS, not significant. N = 3 independent experiments per line.

