Fig. 2.
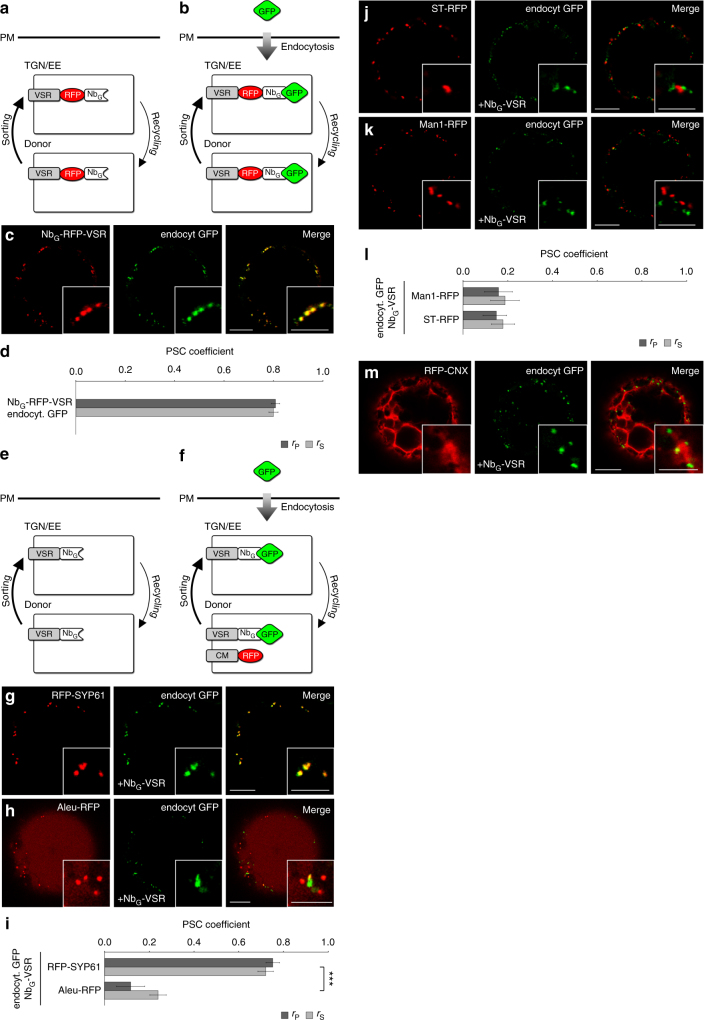
Localization of post-translationally labeled NbG-tagged VSRs. a Cycling NbG-tagged red fluorescent VSRs are b post-translationally labeled by endocytosed GFP. c GFP-labeled red fluorescent NbG-tagged VSRs. d Pearson’s (rP) and Spearman’s (rS) correlation (PSC) coefficients of NbG-RFP-VSRs and labeling GFP. Data are presented as average ± s.e.m. of 10 individual cells. The graph shows a representative sample of two independent experiments. e, f Colocalization of post-translationally GFP-labeled non-fluorescent cycling NbG-tagged VSRs (NbG-VSR) with red fluorescent compartmental markers (CM) for g, i the TGN/EE, h, i MVBs/LEs and vacuole, j, l the trans−/ and k, l cis-Golgi and m the ER. i, l PSC coefficients of the labeled NbG-VSR and coexpressed markers RFP-SYP61, Aleu-RFP, Man1-RFP and ST-RFP are calculated and presented as in d. Graphs show a representative sample of two independent experiments. Labeled NbG-VSRs colocalize with the TGN/EE marker but not with markers for MVB/LE and vacuole and the cis-/trans-Golgi. i Significance was calculated using unpaired, two tailed t-test (n = 10, ***P < 0.001). Scale bars 10 µm, insets 5 µm. Insets show magnifications

