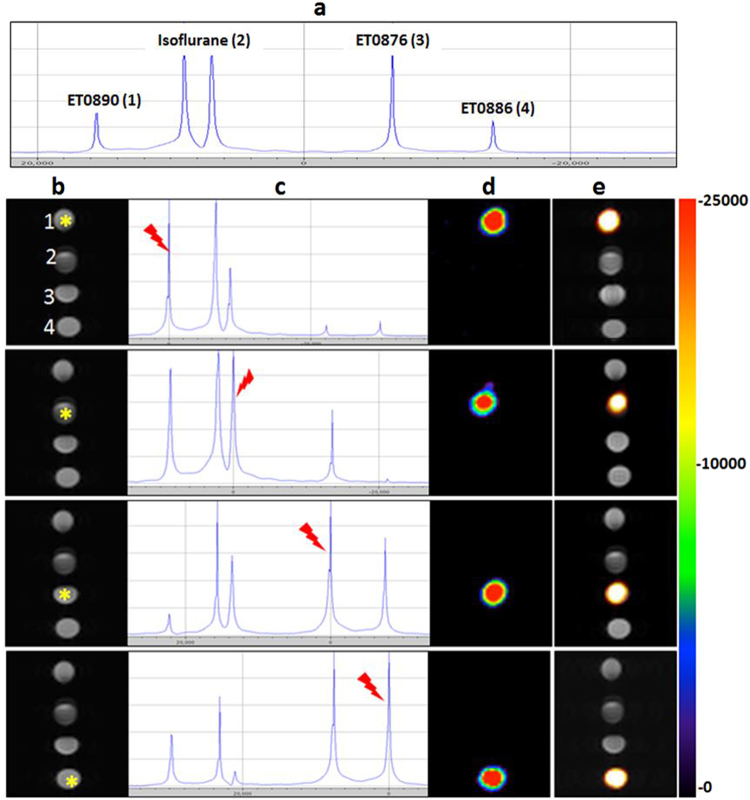
Figure 4.
In vitro evaluation of 19F MRI spectral imaging potential of probes. (a) Single pulse 19F MR scan of a set of phantoms comprising the three formulations and Isofluran show resonance frequencies of all fluorine species in the magnet. (b) TurboRARE T2 (TR = 2500 ms, TE = 11 ms, Rare factor = 4, scan time = 5 min 20 s, Matrix size = 64 × 64), 1H MR image of phantoms (1 = ET0890, 2 = Isoflurane, 3 = ET0876, and 4 = ET0886), mimicking anatomy of subject in the bore of the magnet. (c) Single pulse 19F MR scan with resonance frequency of the starred phantom in (a), indicated by the red pointer. (d) 19F MR image following a 19F MSME scan (same scan parameters as in Fig. 3 above), of the selected frequency. The artifact observed in phantom number 2 (Isoflurane) is due to the second Isoflurane peak. (e) Overlay of 19F MR image over 1H MR image of all the phantoms, reports on the exact location of each phantom on the rack.

