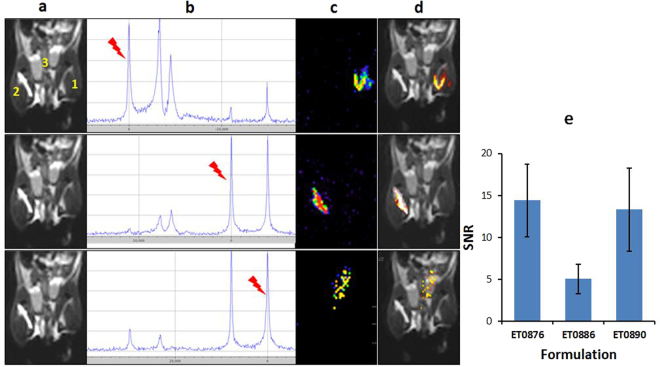
Figure 5.
Evaluation of the spectral 19F MR imaging potential probes in an in vivo environment. (a) TurboRARE T2 1H MR (same scan parameters as in Fig. 4 above) anatomy image of a isoflrane anesthetized mouse injected intramuscularly with formulations ET0876 (right thigh, position 2), and ET0890 (left thigh, position 1), and subcutaneously ET0886 (abdomen, position 3). (b) Single pulse 19F MR scan showing resonance frequencies of 19F species within the subject in the scanner with frequencies of interest highlighted by the red pointer. (c) 19F MR image obtained from a 19F MSME scan protocol (same scan parameters as in Fig. 4 above), of the selected frequency. (d) overlay of 19F MR image over anatomy image reports on location of each probe. (e) SNR of formulations in vivo (n = 4).

