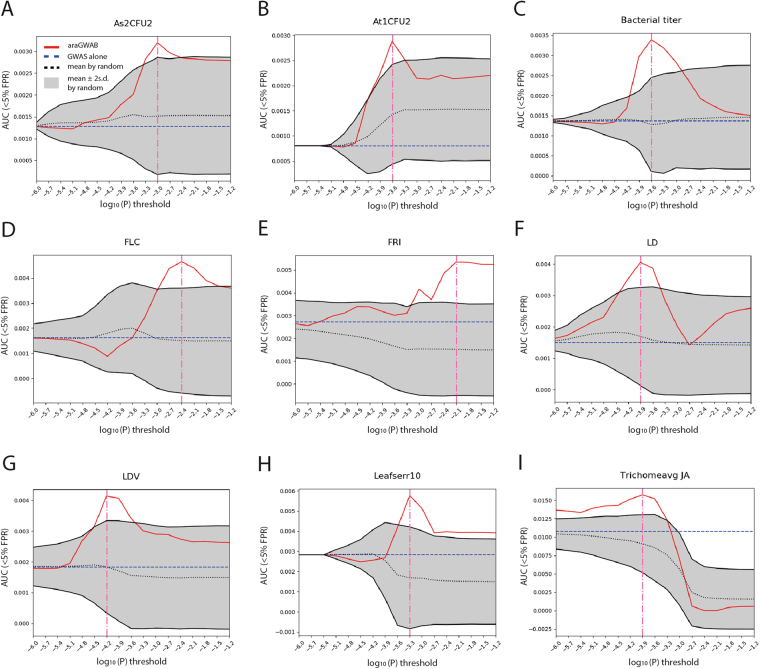
Figure 2.
Performance of network boosting of GWAS signals by araGWAB. The retrieval efficiencies of the user-input reference phenotype-associated genes by araGWAB (red line), GWAS alone (blue dotted line), and 100 randomized gene networks (grey region for two standard deviations) were measured by the area under the receiver operating characteristic curve (AUC) before 5% false positive rate (AUC (<5% FPR), y-axis) for the given range of the log10(P) threshold (x-axis). The vertical pink line denotes the optimal P-value threshold. Here, we showed the performance curves for nine phenotypes: (A–C) phenotypes for defense against bacterial pathogens, (D–G) phenotypes for flowering time regulation, and (H and I) phenotypes for organ development.

