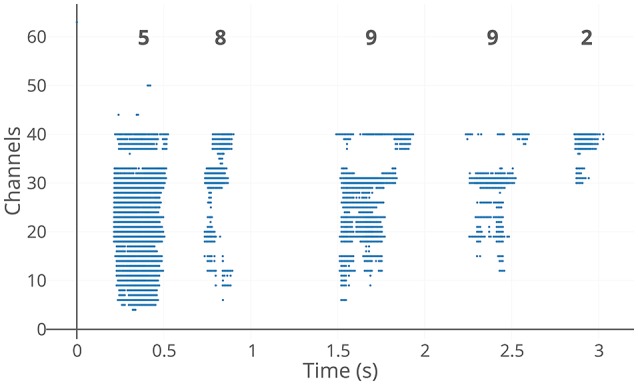
Figure 1.

CochleaAMS1c spike output example. The y-axis indicates the 64 frequency channels of the sensor with lower frequency channels at the top. The spikes are in response to the spoken digit sequence “5-8-9-9-2” from the speaker “IM” in the TIDIGITS dataset. The five digits in the sequence can be clearly seen to be apart with significant gaps between them in the encoded sample above. This example also demonstrates the data driven nature of the sensor where it outputs events only when there's a stimulus in the environment.
