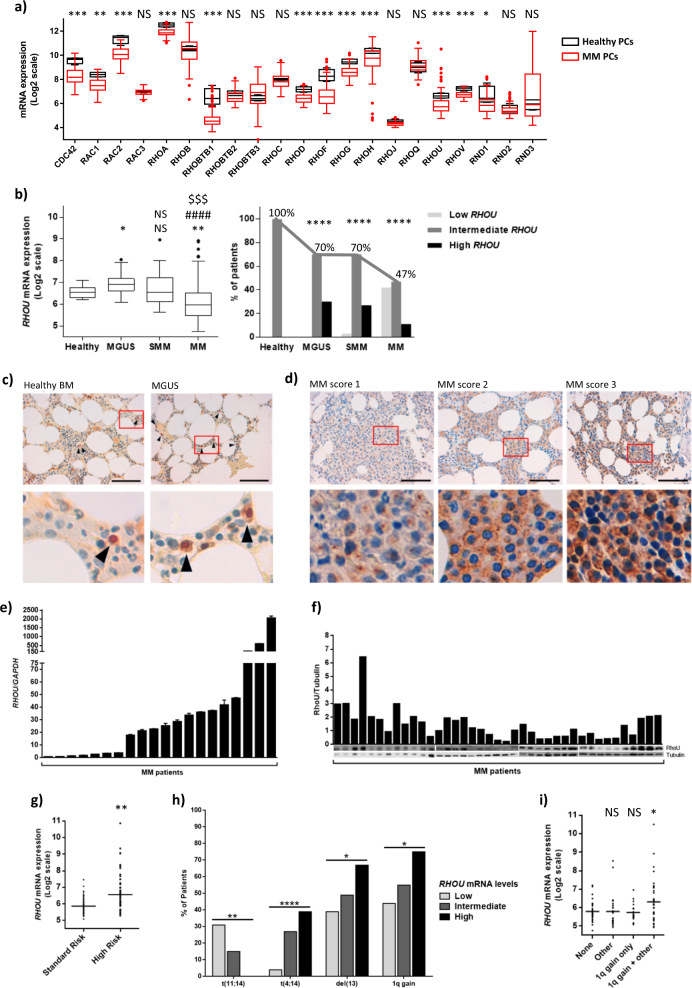
Fig. 1. RhoU is heterogeneously expressed in MM.
a Rho GTPase family members’ expression in healthy and MM PCs. Box plot showing mean ± SD of healthy PCs from four donors (red) and mean ± SD of MM PCs from 129 MM patients at diagnosis (black). In the x axis are all the members of the Rho GTPase family in alphabetical order. Student’s t test *p < 0.05; **p < 0.01; ***p < 0.001 when compared to healthy PCs. b left: RHOU expression in the different steps of MM progression. Box plot showing mean ± SD of healthy PCs from nine donors, MGUS PCs from 20 patients, sMM PCs from 33 patients and MM PCs from 170 patients at diagnosis. Student’s t test: NS non significant; *p < 0.05; **p < 0.01; ***p < 0.001; ****p < 0.0001 (*compared to healthy; #compared to MGUS; $compared to SMM). right: Bar chart showing the percentage of patients for each step of the disease that fall in the diverse groups of RHOU expression. Patients were divided in three groups with low (<mean−2 SD of healthy controls), intermediate, and high (>mean + 2 SD of healthy controls) RHOU expression. Chi square test of patients’ distribution: ****p < 0.0001 when compared to healthy. c RhoU expression in BM biopsies of a healthy donor and a representative MGUS patient. PCs in the samples are indicated with black arrows. Nucleuses of PCs are positive for IRF4 staining and are therefore red. d IHC staining showing low (MM score 1), intermediate (MM score 2) and high (MM score 3) positivity for RhoU staining in BM biopsies from representative MM patients. c and d Original magnification x60; inset with x5 digital zoom; scale bar = 100 μm. e Bar charts showing qRT-PCR RHOU/GAPDH ratio values in PCs purified from 20 MM patient’s biopsies. Mean ± SD of technical triplicates is shown for each samples. f Immunoblot and densitometry of RhoU/Tubulin in PC lysates from 39 MM patient’s biopsies. g Aligned dot plot with RHOU expression in patients that fall in the standard risk (TC1 and TC2) and high risk (TC3, TC4, and TC5) groups. Mean expression in each group is marked with a bar. p value was calculated by Student’s t test. h Bar chart representing the percentage of patients from each of the three groups with low (<mean—2 SD of healthy controls), intermediate, and high (>mean + 2 SD of healthy controls) RHOU expression that exhibit a particular genetic alteration. Student’s t test for trend *p < 0.05; **p < 0.01; ****p < 0.0001. i Aligned dot plot with RHOU expression in patients that don’t present any unfavorable cytogenetic alterations (none), that present unfavorable cytogenetic alterations but not 1q gain (other), that present only 1q gain, and that present 1q gain combined with other unfavorable cytogenetic alterations. Student’s t test: NS non significant; *p < 0.05

