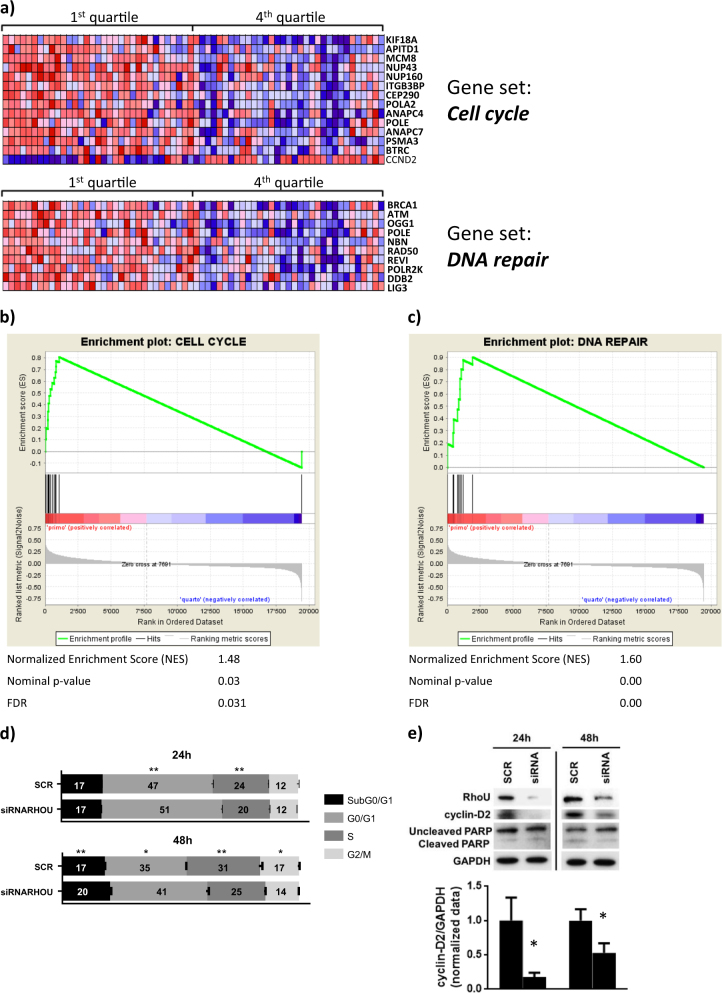
Fig. 2. Patients with high and low RHOU expression have different gene expression profiles.
a Heat map of genes contributing to the core enrichment in the “Cell Cycle” and “DNA Repair” gene sets detected by GSEA analyzing significantly up-regulated genes (p-value ≤ 0.05) in RHOU quartile I versus IV (indicated in bold). Enrichment plots for b “Cell Cycle” and c “DNA Repair” gene sets. The green curves show the enrichment score and reflect the degree to which each gene (black vertical lines) is represented at the bottom of the ranked gene list. d Cell cycle analysis based on PI staining of SCR and siRNA RHOU cells 24 and 48 h after transfection. Data represents mean ± SD of three independent experiments. Student’s t test: *p < 0.05; **p < 0.01. e Representative immunoblots from six samples from two independent experiments of RhoU and cyclin D2 expression 24 and 48 h after siRNA transfection, and densitometry of the mean expression of cyclin D2/GAPDH ± SD

