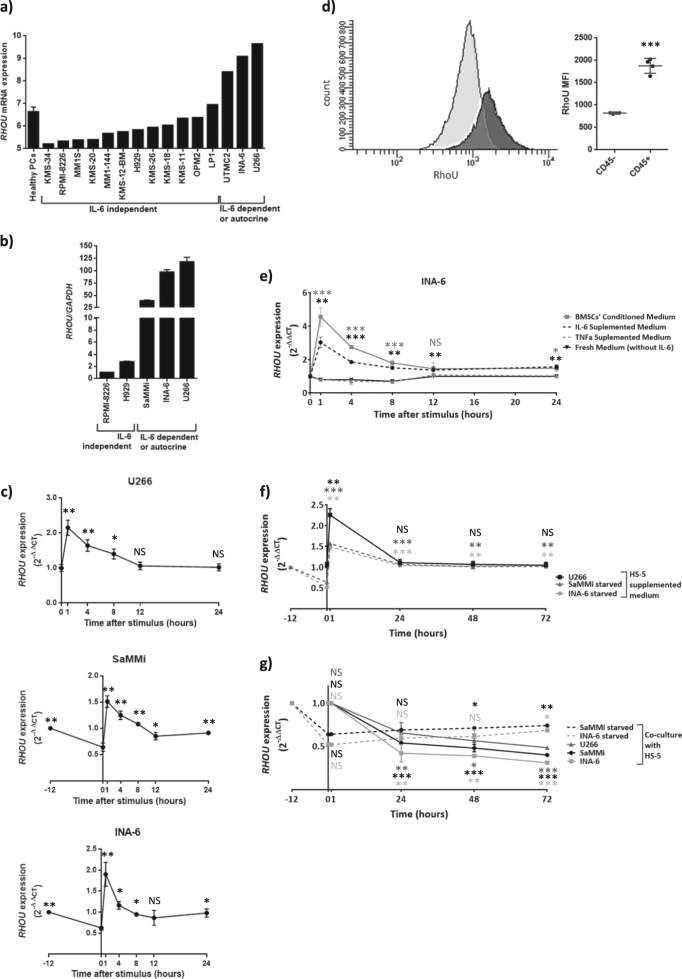
Fig. 3. RHOU expression in MM cell lines relies on IL-6 stimulus.
a Bar chart showing RHOU expression assessed by GEP (#GSE66293) in MM cell lines as compared to healthy PCs. b Bar chart showing RHOU expression in MM cell lines assessed by RT-PCR. Data represents normalized mean ± SD of three independent samples of each cell line. c Time-course of RHOU expression after IL-6 stimulus showing a significant increase in RHOU expression as early as one hour after stimulus; time points before zero correspond to IL-6 starvation period. d Left: representative dot plot showing intracytoplasmic RhoU staining in the CD45+ and CD45− populations of U266 cell line. Right: mean ± SD of four samples mean fluorescence intensity of intracytoplasmic RhoU staining in the CD45+ and CD45− populations of U266 cell line. e Time-course of RHOU expression after the addition of IL-6, TNF-α, BMSCs’ conditioned medium or fresh unsupplemented medium. f Time-course showing the changes in RHOU expression after the addition of HS-5 supplemented medium of starved and not starved cell lines. g Time-course showing the changes in RHOU expression after co-culture with HS-5 of starved and not starved cell lines. c, e, f, and g Data represents mean ± SD of six samples from at least two independent experiments normalized over mean expression at time zero. Student’s t test: NS non significant; *p < 0.05; **p < 0.01; ***p < 0.001, when compared to time zero of untreated

