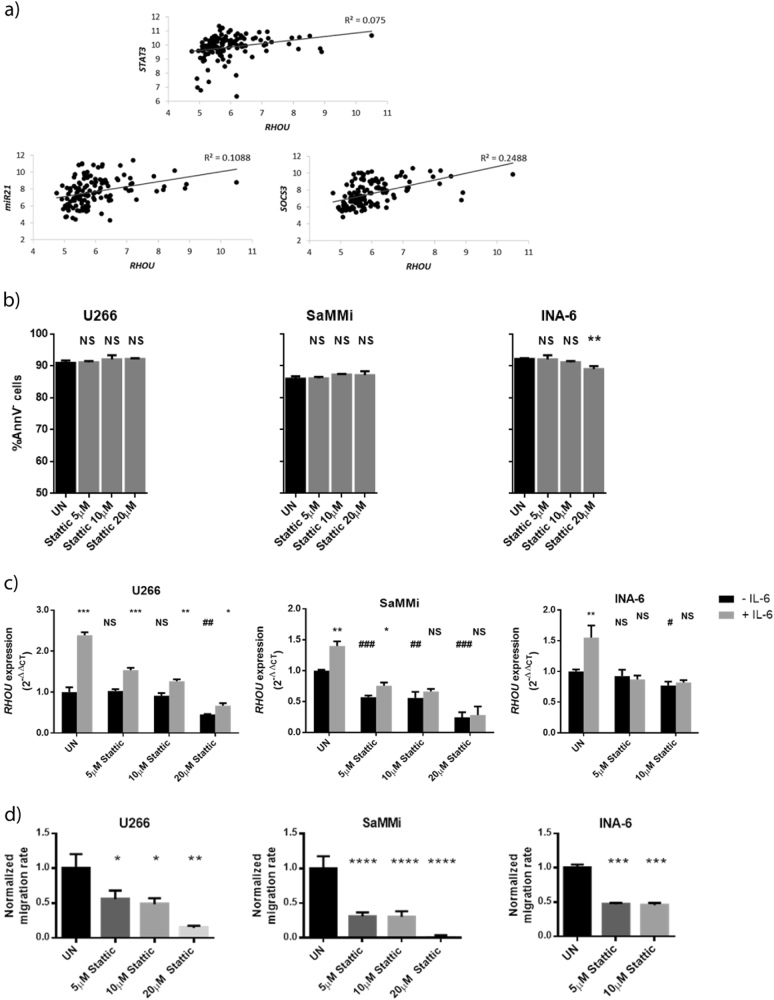
Fig. 4. In MM cell lines RHOU expression lays downstream of STAT3 activation.
a Correlation between RHOU expression and STAT3 expression (Pearson’s r = 0.2739; p-value = 0.0017) or MIR21 expression (Pearson’s r = 0.3299; p-value = 0.0001) or SOCS3 expression (Pearson’s r = 0.4988; p-value = 1.786e-09). b Bar charts showing the percentage of live cells (AnnV−) after treatment with different doses of Stattic. c Bar charts showing RHOU expression after STAT3 inhibition before and after IL-6 stimulus. Black bars represent RHOU expression after 6 h of culture with different concentrations of stattic. Grey bars show RHOU expression after 5 h of stattic treatment + 1 h of combined treatment with IL-6 stimulus. *Compared with same treatment conditions without IL-6 stimulus, #Compared to UN. d Bar charts exhibiting normalized mean cell count ± SD of four samples from at least two independent experiments, after treatment with increasing concentrations of stattic, accessed by migration assay with IL-6, normalized over mean migration of UN. b, c, and d UN untreated; student’s t test: NS non significant; *p < 0.05; **p < 0.01; ***p < 0.001; ****p < 0.0001

