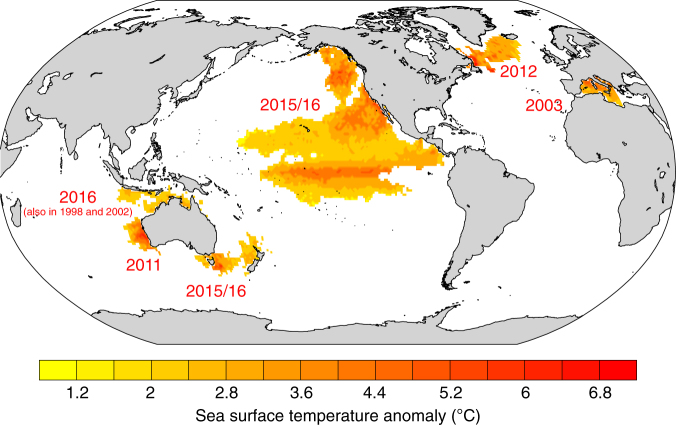
Fig. 1.
Summary of prominent recent marine heat waves that are documented and analyzed in the literature. The figure shows the maximum sea surface temperature anomaly in regions where temperature exceeds the 99th percentile using NOAA’s daily Optimum Interpolation sea surface temperature dataset11. The numbers indicate the year of the MHW occurrence. The 99th percentile is calculated over the 1982–2016 reference period. The map was created using the NCAR Command Language (https://www.ncl.ucar.edu)

