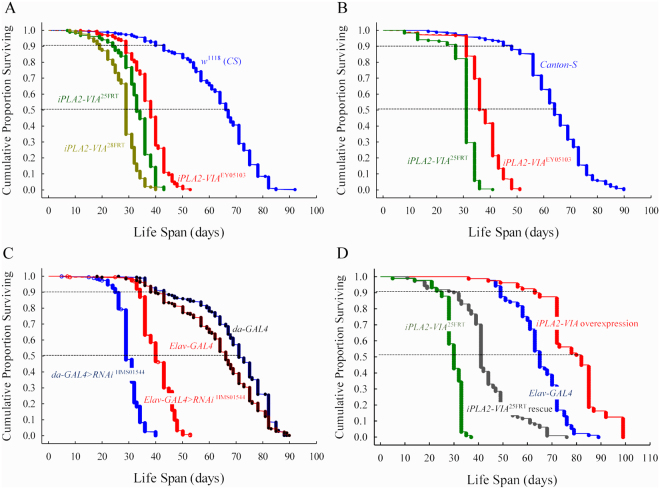
Figure 2.
iPLA2-VIA mutants exhibit reduced lifespan. Kaplan–Meier survival curves for. (A) P-element mutant iPLA2-VIAEY05103 (n = 297, red color); null mutant lines: iPLA2-VIA25FRT (n = 324, green color) and iPLA2-VIA28FRT (n = 314, light green) and the genetic background, cantonized w1118 control line (n = 302, blue color). (B) Cantonized w+ ; iPLA2-VIA25FRT null mutant line (n = 169, green color), cantonized iPLA2-VIAEY05103 (n = 213, red color) and wild-type Canton-S lines (n = 192, blue color). (C) Survival curves for ubiquitous da-GAL4 > RNAiHMS01544 (n = 313, blue color) and pan-neuronal elav-GAL4 > RNAiHMS01544 (n = 410, red color) RNAi-mediated knockdown and its control lines: elav-GAL4 (n = 268, red color with black dots) and da-GAL4 (n = 298, blue color with black dots). (D) Survival curves for iPLA2-VIA25FRT null (n = 91, green color) and pan- neuronal rescue line elav-GAL4; iPLA2-VIA25FRT, 6UAS-iPLA2-VIA (n = 112, black color); elav- GAL4 control line (n = 83, blue color) and elav-GAL4 driven overexpression of iPLA2-VIA line (n = 80, red color).

