Figure 1.
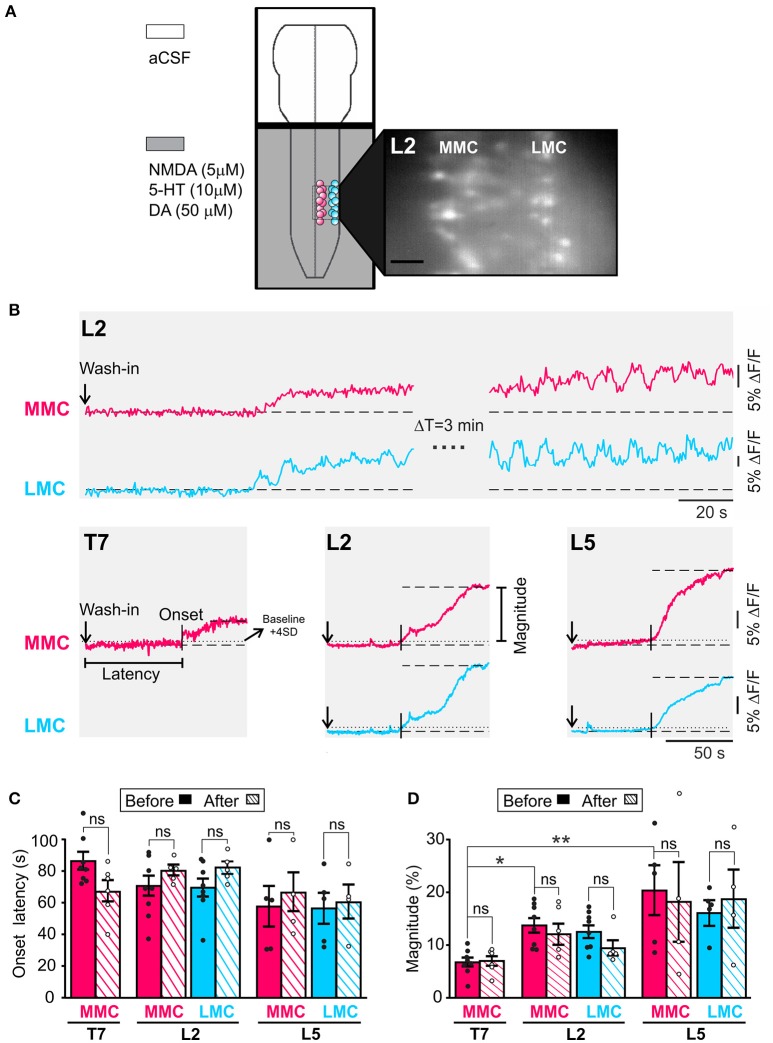
An initial period of tonic activity accompanies rhythmic activity both in MMC and in LMC MNs. (A) Schematic representation of the experimental arrangement. The recording chamber was partitioned in two compartments with a plastic bridge sealed with petroleum jelly. The brain stem compartment (top) was superfused with aCSF while the spinal cord compartment (bottom) was superfused with aCSF plus NMDA (5 μM), 5HT (10 μM), and DA (50 μM). The presence of the neurochemicals is indicated by the gray shading. MNs in the MMC (red circles) and LMC (blue circles) were loaded with fluorescent calcium indicator CaGDA (see Methods). Inset: Photomicrograph of CaGDA loaded MMC and LMC MNs in L2. Scale bar is 25 μm. (B) Top: Changes in fluorescence following the arrival of the neurochemicals to the spinal cord compartment in a single MMC MN (red waveform) and LMC MN (blue waveform). The recording bouts on the left show the slow building up of the tonic component of LLA in each MNs. The recording bouts on the right, which were acquired 3 min later, show the same tonic component as it reaches maximal magnitude (plateau). Bottom: Population responses (large ROI covering the entirety of the motor columns) showing the tonic component of LLA in MMC MNs of T7, L2, and L5 segments and LMC MNs of L2 and L5 segment. Vertical arrows: Time of application of neurochemicals. Vertical bars: Onset latency. Horizontal dashed line: Mean baseline fluorescence. Horizontal dotted line: Mean baseline fluorescence +4 SD. (C) Bar graph showing the mean onset latency of the tonic component in T7, L2, and L5 MNs before (solid bars) and after (hatched bars) removal of the brain stem. Each bar is a grand average across all experiments (individual points). Mean onset latencies of tonic activity were similar before and after removal of the brain stem (Wilcoxon matched-pairs test, T7 MMCbefore vs. MMCafter p = 0.22; L2 MMCbefore vs. MMCafter p = 0.31; L5 MMCbefore vs. MMCafter p = 0.25; L2 LMCbefore vs. LMCafter p = 0.31; L5 LMCbefore vs. LMCafter p > 0.99). (D) Bar graph showing the magnitude of the tonic component in T7, L2, and L5 MNs before (solid bars) and after (hatched bars) removal of the brain stem. Each bar is a grand average across all experiments (individual points). The mean magnitudes of tonic component were similar before and after removal of the brain stem (Wilcoxon matched-pairs test, T7 MMCbefore vs. MMCafter p = 0.84; L2 MMCbefore vs. MMCafter p = 0.88; L5 MMCbefore vs. MMCafter p > 0.99; L2 LMCbefore vs. LMCafter p > 0.99; L5 LMCbefore vs. LMCafter p > 0.99). *p < 0.05, **p < 0.01.

