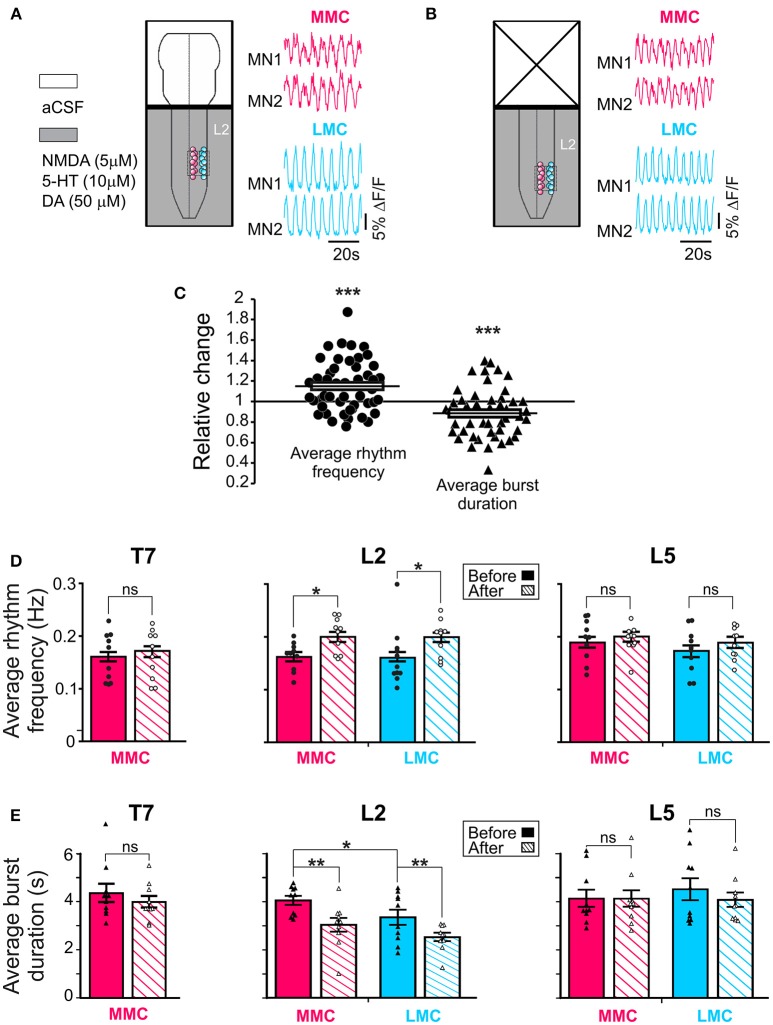
Figure 2.
Regulation of the locomotor rhythm frequency and burst durations by the brain stem. Schematic representations of the experimental arrangement before (A) and after (B) removal of the brain stem shown together with corresponding set of waveforms displaying changes in fluorescence in two L2 MMC MNs (red) and two L2 LMC (blue) MNs (for other details, see Figure 1A). The same four MNs are shown in the two panels. (C) Pooled data from 50 motor columns (10 motor columns in T7, 20 motor columns in L2 and in L5) showing relative change in average rhythm frequency (solid circles) and burst duration (solid triangles) after removal of the brain stem. (D,E) Bar graphs showing the average rhythm frequency and average burst duration in MMC (red) and LMC MNs (blue) in the individual segments before and after removal of the brain stem (solid and hatched bars, respectively). Each bar is a grand average across all experiments. The increase in rhythm frequency after removal of the brainstem was statistically significant in L2 (paired t-test, L2 MMCbefore vs. MMCafter p = 0.003; L2 LMCbefore vs. LMCafter p = 0.048; T7 MMCbefore vs. MMCafter p = 0.79; L5 MMCbefore vs. MMCafter p = 0.86; L5 LMCbefore vs. LMCafter p = 0.26). Removal of the brain stem also significantly reduced the average burst durations in L2 (paired t-test, L2 MMCbefore vs. MMCafter p = 0.003; L2 LMCbefore vs. LMCafter p = 0.004; T7 MMCbefore vs. MMCafter p = 0.26; L5 MMCbefore vs. MMCafter p = 0.97; L5 LMCbefore vs. LMCafter p = 0.34). *p < 0.05, **p < 0.01, ***p < 0.001.

