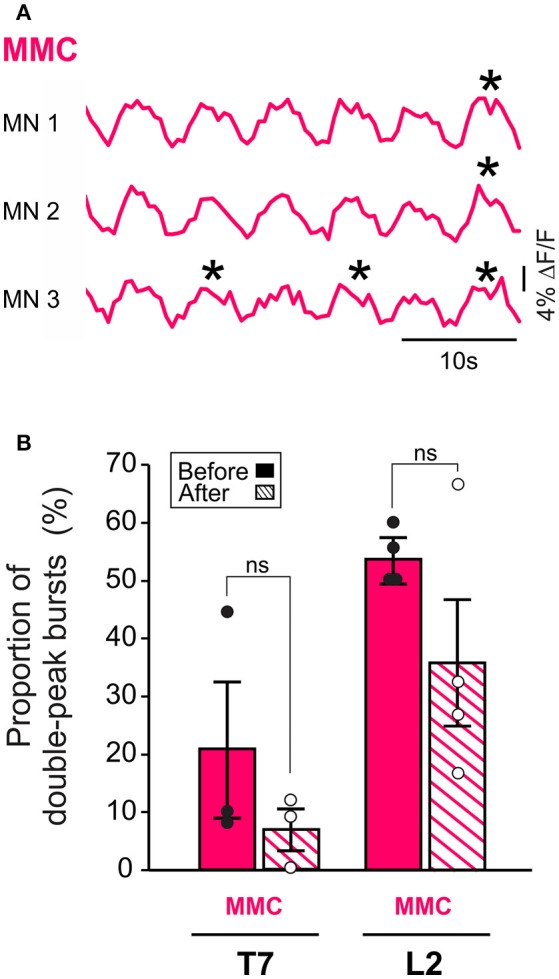
Figure 3.

MMC MNs display double-peak bursts during LLA. (A) Changes in fluorescence in three individual MNs in the left MMC (top) and right MMC (bottom). Asterisks indicate double-peak bursts (see Methods). (B) Bar graphs showing the mean frequency of occurrence of double-peak bursts in MMC MNs of T7 and L2 before (solid bars) and after (hatched bars) removal of the brain stem. Each bar is a grand average across all experiments (individual points).
