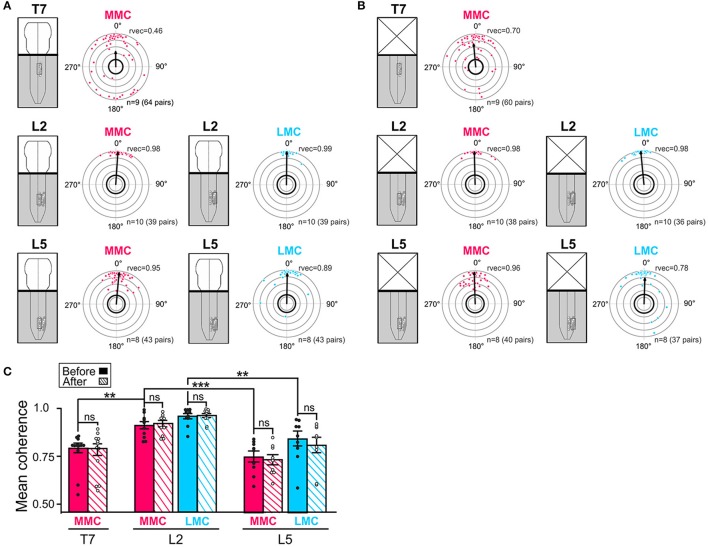
Figure 4.
Temporal relationships and coupling strengths (coherence) between MNs of the same motor column before and after removal of the brain stem. (A,B) Intra-columnar phase relationships between pairs of MNs in T7 MMC (top), L2 MMC and LMC (middle) and L5 MMC and LMC (bottom) before and after removal of the brain stem, respectively. Phase relationships between MN pairs are shown as phase differences in circular plots. Individual dots represent individual MN pairs (red = >MMC, blue = >LMC). The direction of the vectors (arrows) indicates mean phase difference (0° = >synchronous, 180° difference = >alternating) whereas the length of the vectors (rvec) indicates the extent to which the phase differences are clustered around the mean on a scale from 0.0 (origin) to 1.0 (outermost gray circle). The circle with thick black outline indicates the p < 0.05 level of statistical significance as determined by the Rayleigh test. Number of experiments and number MN pairs analyzed indicated at the bottom of each circular plots. The lower average vector length “rvec” in T7 indicates a more widespread distribution of phase differences between MNs in this segment than in L2 or L5. Phase differences were clustered in two groups around 0 and 180°. The changes in mean phase vectors after removal of the brainstem were not statistically significantly (Watson–Williams F-test, T7 MMCbefore vs. MMCafter F = 0.83, p = 0.38; L2 MMCbefore vs. MMCafter F = 2.25, p = 0.15; L2 LMCbefore vs. LMCafter F = 2.53, p = 0.13; L5 MMCbefore vs. MMCafter F = 1.28, p = 0.28; L5 LMCbefore vs. LMCafter F = 1.28, p = 0.63). (C) Bar graph showing the mean coherence before (solid bars) and after (hatched bars) removal of the brain stem. The coupling between MNs was significantly tighter in L2 than in T7 or L5 both before and after removal of the brain stem (Kruskal-Wallis test followed by a Dunn's multiple comparison, L2 MMCbefore vs. T7 MMCbefore p = 0.007; L2 MMCbefore vs. L5 MMCbefore p = 0.0004; L2 LMCbefore vs. L5 LMCbefore p = 0.001; L5 MMCbefore vs. T7 MMCbefore p > 0.99; Wilcoxon matched paired test, T7 MMCbefore vs. MMCafter p = 0.82; L2 MMCbefore vs. MMCafter p = 0.56; L2 LMCbefore vs. LMCafter p> 0.99; L5 MMCbefore vs. MMCafter p = 0.73; L5 LMCbefore vs. LMCafter p = 0.57). **p < 0.01, ***p < 0.001.

