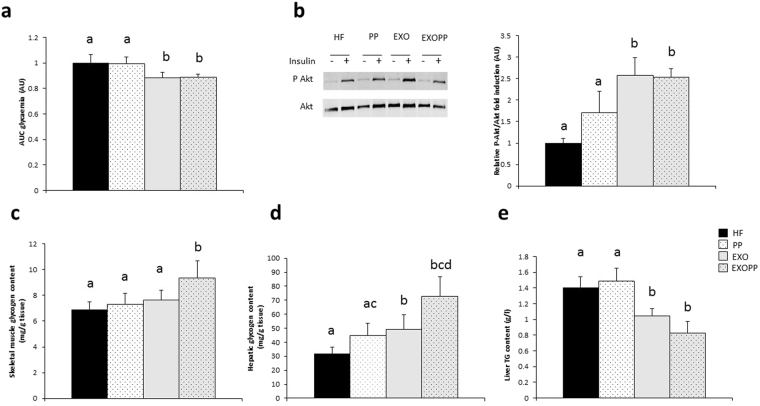
Figure 4.
Measure of whole-body glucose homeostasis, skeletal muscle insulin sensitivity and glycogen content. (a) Area under the curve (AUC) for glycaemia. (b) P-Akt and Akt expression levels in soleus skeletal muscle, measured by immunoblotting after ex vivo insulin stimulation. A representative blot is shown. Quantification values are presented as P-Akt/Akt fold induction and are expressed relative to the HF value, which was set at 1. (c) and (d) Glycogen content in skeletal muscle (c) and liver (d). (e) Hepatic triglyceride content. Data are expressed as mean ± SEM with n = 8–10 rats per group. Bars not sharing a common letter are significantly different at p < 0.05.

