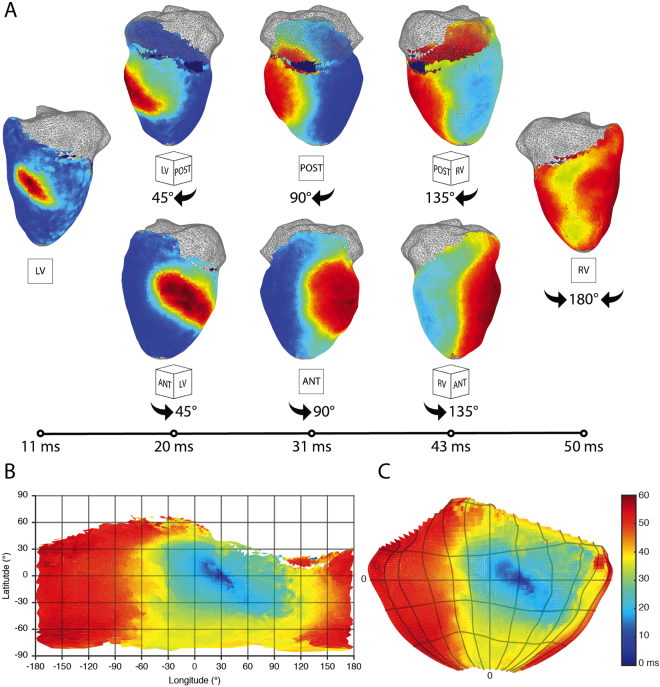
Figure 5.
Activation in representative rabbit panoramic optical data. (A) The time course of pacing activation is tracked using membrane potential. A paced beat starts on the left ventricular free wall and the divergent wavefronts are tracked over time around both the posterior and anterior sides to where they meet on the right ventricular free wall. Wavefronts are uninterrupted by artifact or discontinuity. (B) On the left, a 2D Mercator projection of the isochronal activation map generated using the processing GUI. On the right, a 2D Hammer projection whose latitude and longitude divisions are the same as seen in the Mercator projection.

