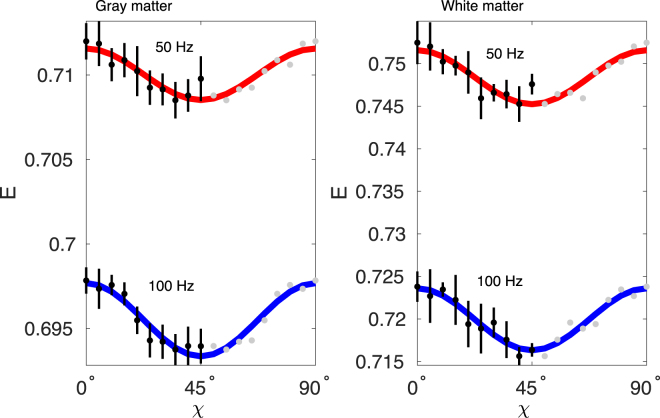
Figure 4.
Signal (dots) and fitted model (solid lines) over ellipticity angle χ in the gray and white matter ROIs at 50 Hz and 100 Hz. Data were averaged over waveforms with the same eccentricity to achieve a more robust estimate of a uniform distribution and points over 45° are mirrored and redundant and thus plotted in gray. The standard deviation over 6 averages are shown as error bar for each data point. Note that the y-scales are different and that the χ-modulation is larger in white matter.

