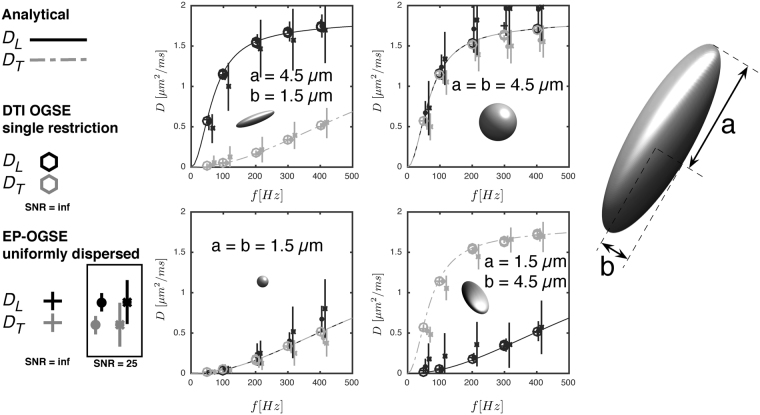
Figure 6.
Longitudinal (black) and transversal (gray) temporal diffusion spectra for ellipsoidal restrictions with longitudinal and transversal axes (a and b) estimated from EP-OGSE Monte Carlo simulations of fully dispersed samples (crosses) compared to estimates from conventional DTI OGSE of single compartments (hexagons). The EP-OGSE estimates were also estimated from noisy data with SNR = 25 using both a maximum b-value of 1.6 s/μm2 and 0.6 s/μm2 shown as filled dots and asterices. The latter b-value is in the range possible up to 100 Hz at a maximum gradient strength of 300 mT/m. The error bars indicate the standard deviation of each estimate. The solid lines are the analytical solutions for spheres with radii a (solid black) and b (gray dashed).

