Fig. 1.
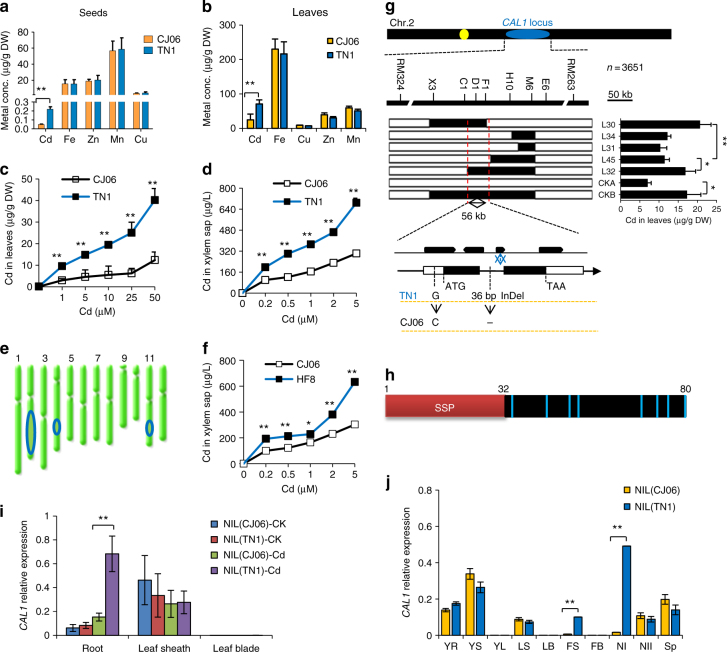
Map based cloning and expression of CAL1. a–d Characterization of metals accumulation and transport in rice cultivars TN1 and CJ06. Metal accumulation in grains from rice grown in contaminated paddy field (a), or leaves from seedlings exposed to 10 µM Cd for 7 days (b). Cd levels in leaves (c) and xylem sap (d) from rice seedlings exposed to Cd for 7 days at indicated concentrations. All seedlings were grown in hydroponics to 2-week-old before treatments (b, c, d). e QTLs controlling Cd accumulation in rice leaves. Blue ovals indicate the rough genetic intervals that QTLs locate. f Cd concentrations in xylem sap from the CSSL line HF8 and the low accumulation cultivar CJ06. g Cloning of CAL1. Fine mapping (top) and high-resolution mapping (middle) delimited the CAL1 locus to a 56-kb region. Middle right, foliar Cd contents of recombinant lines L30 and L32 and the control CKB (homozygous for TN1 in the target region) were essentially higher than those of L34, L31, and L45 and the control CKA (homozygous for CJ06 in the target region) under 10 µM Cd for 7 days. Low, gene structure and sequence variation of CAL1 between TN1 and CJ06. h Structural model of the CAL1 precursor. Red box represents the putative secretion signal peptide domain (SSP); black box represents mature protein. Light blue bars indicate cysteine residues, and numbers indicate the sequence number of amino acids. SSP was predicted by web tool signaIP 4.1 server. i CAL1 expression in roots, leaf sheath and leaves blade of 2-week-old seedlings treated with Cd at 0 µM (CK) or 10 µM (Cd) for 7days. j Expression pattern of CAL1 in various rice tissues. YR young root, YS young leaf sheath, YL young leaf blade, LS leaf sheath, LB leaf blade, FS flag sheath, FB flag blade, NI node I, NII node II, SP spikelet. Data are mean ± SD, n = 3 in (a–d, f, i, j), or n = 5 in (g), and normalized to Actin1 (i) or HistoneH3 (j), respectively. Significant differences were determined by Student’s t-test (*P < 0.05, **P < 0.01)

