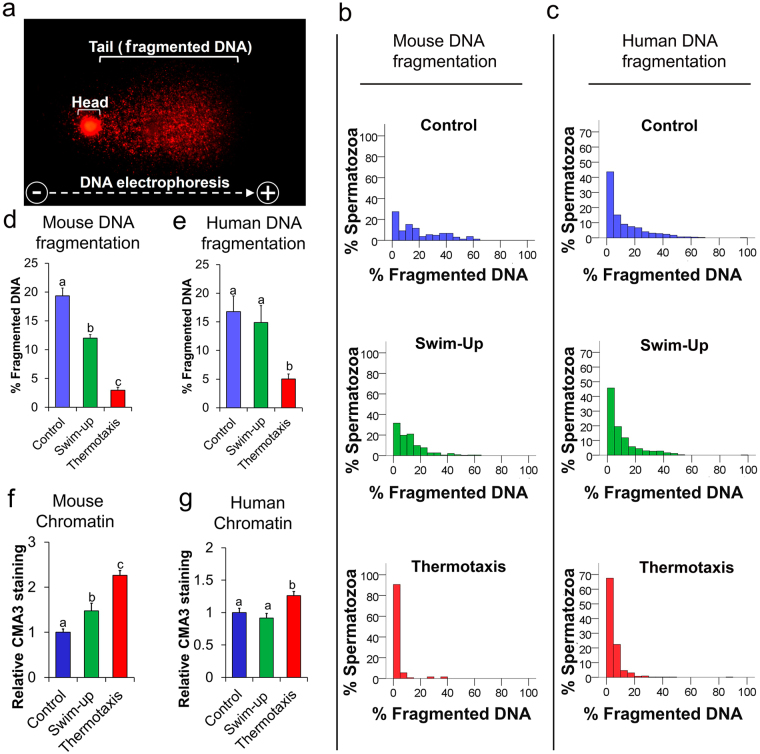
Figure 3.
Quality of spermatozoa. Analyses performed in unseparated mouse and human spermatozoa (control –in humans this is the sample obtained after removing seminal plasma by centrifugation), after swim-up, or after selection by thermotaxis. (a) Representative image of SCGE in which fragmented DNA appears as a tail migrated from the nucleus (head) of the spermatozoa in response to electrophoresis. (b and c) Percentages of fragmented DNA determined using alkaline (mouse) or neutral (human) SCGE (mean ± SEM, n = 5 for mouse and n = 8 for human, 50–100 spermatozoa per determination). Different letters indicate significant differences (P < 0.001 two–way ANOVA). (d and e) Histograms showing the distributions of % of fragmented DNA in individual spermatozoa in each sample (n = 5 for mouse and n = 8 for human, 400–750 spermatozoa per histogram). (f and g) Chromatin compaction assessed through chromomycin A3 (CMA3) (n = 4, 50–100 spermatozoa per determination). Different letters indicate significant differences (P < 0.01 two–way ANOVA).

