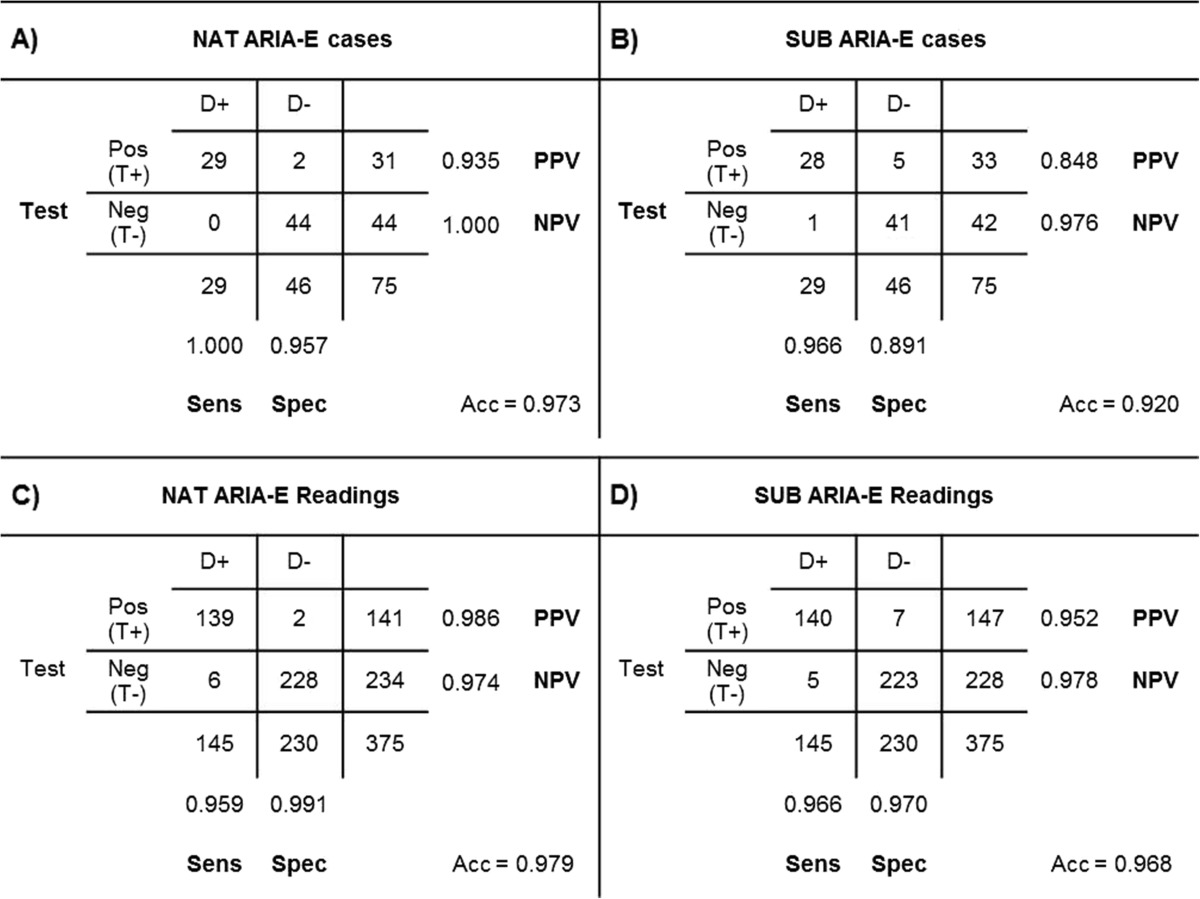
Table 3.
The sensitivity (Sens), specificity (Spec), positive predictive value (PPV) and negative predictive value (NPV) based on a positive/negative test (T+/T-) in ARIA cases (D+) and non-ARIA cases (D-) in (A) native images (NAT) and (B) subtraction images (SUB) if ≥1 rater scored a case with 1 or higher. In sections C and D the detection is shown in all readings of five raters in all 75 case

