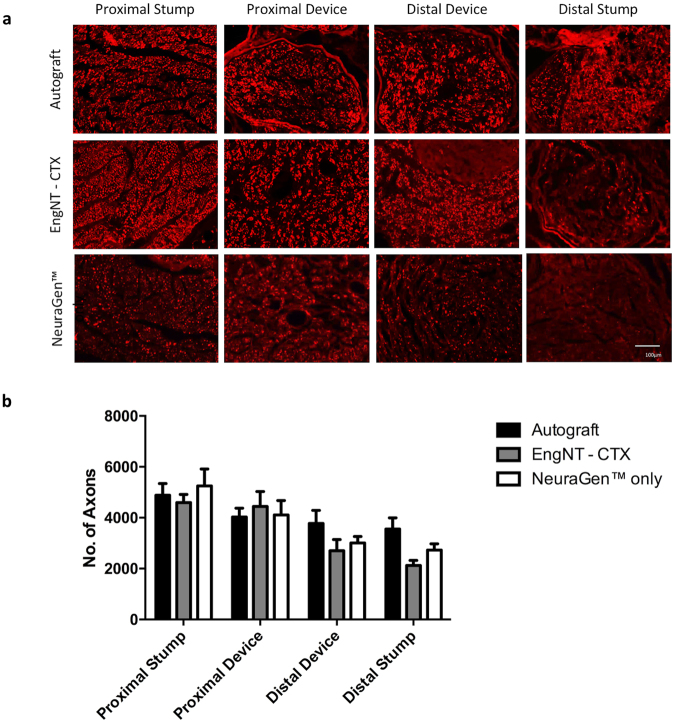
Figure 3.
Quantification of neurites at different positions through repaired nerves. (a) Micrographs are transverse sections showing neurofilament positive neurites at various positions in the repaired nerves (scale bar 100 μm). Neurite growth was assessed by counting the number of neurofilament-positive axons at four different positions through the repairs, proximal stump (PS), proximal device (PD), distal device (DD) and distal stump (DS). Data are means ± SEM, n = 6, showing the number of axons in each repair at the different positions (b). Two-way ANOVA with Tukey’s multiple comparisons test revealed a significant difference (P < 0.0001) in neurites between the four different positions analysed, but no significant difference between the three groups in any position.

