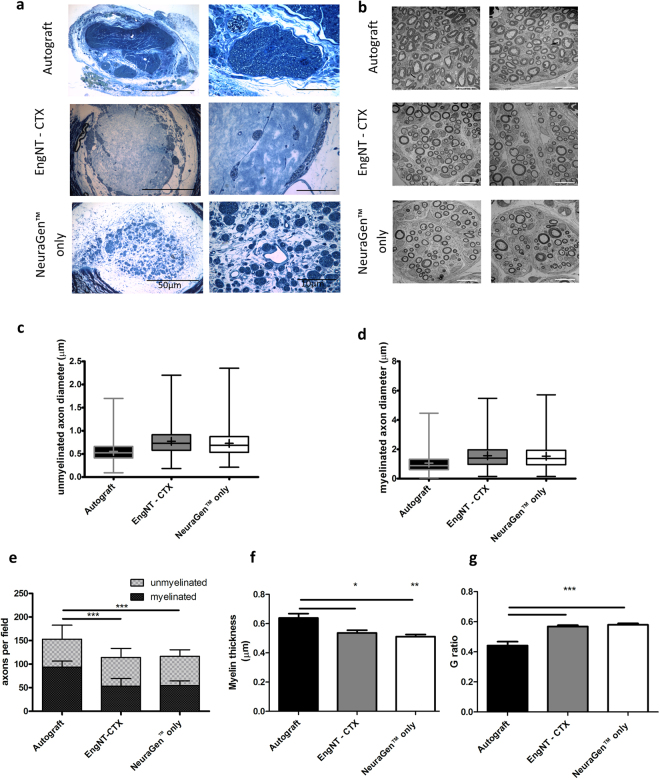
Figure 4.
Distribution and ultrastructure of neural tissue growth at the midpoint of the repair site. Representative semi-thin sections stained with toluidine blue (a) show the differences in density and distribution of neural tissue growth between each condition. Five areas with the highest density in each case were sampled using TEM, with two representative images shown (b). Transmission electron micrographs were quantified to reveal numbers of myelinated and unmyelinated axons per 2000 µm2 field (c), with significant differences in the numbers of myelinated but not unmyelinated axons between groups. (d) and (e) are box plots showing distribution of myelinated and unmyelinated axon diameters respectively (boxes extend from the 25th to 75th percentiles, whiskers show min to max values, horizontal line indicates median and + indicates mean). For myelinated fibres the myelin thickness (f) and G-ratio (g) were also calculated. Data are means ± SEM, n = 6. ANOVA with Tukey’s multiple comparisons test *p < 0.05, **p < 0.01, ***p < 0.001.

