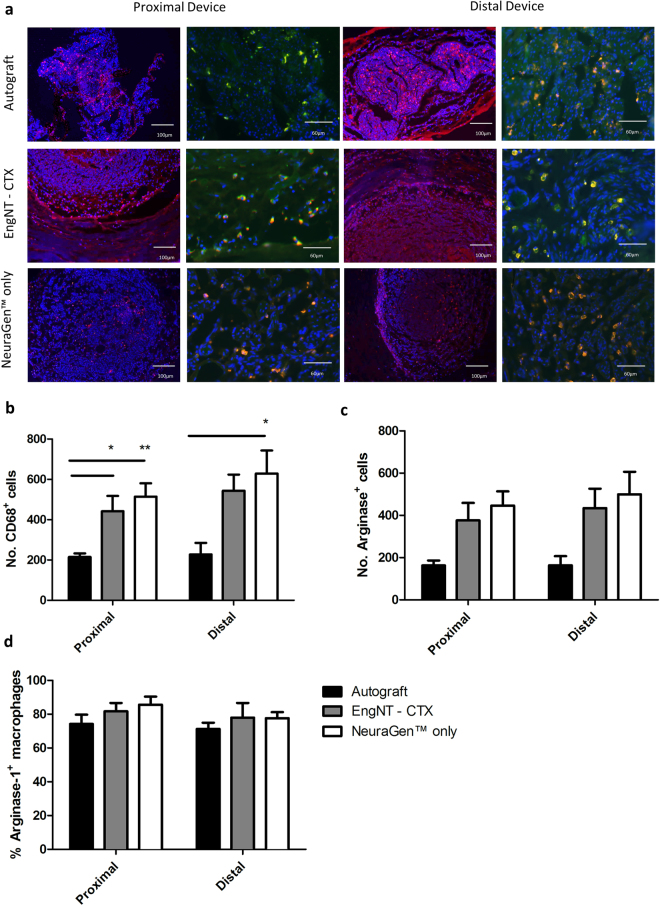
Figure 5.
Quantification of macrophage presence and phenotype in proximal and distal parts of the repair site. Fluorescence micrographs (a) show the presence of CD68+ (red) macrophages and the arginase-1 labelled sub-population of M2 phenotype cells. Hoechst staining was included to detect cell nuclei (blue). Numbers of macrophages positive for CD68 (b) and arginase-1 (c) were quantified in each transverse section, and the proportion of CD68 labelled macrophages that also expressed arginase-1 in each region was calculated (d). Data are means ± SEM, n = 6. ANOVA with Tukey’s multiple comparisons test, *p < 0.05, **p < 0.05.

