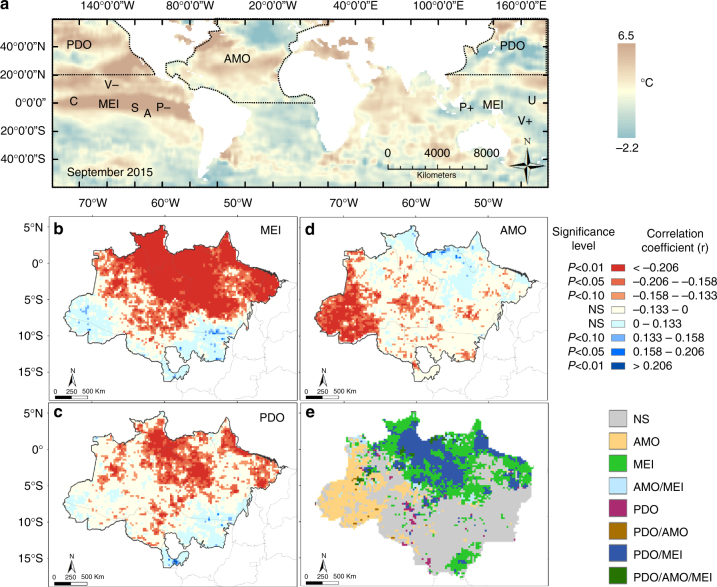
Fig. 2.
Spatial location of oceanic modes and their influence on the spatial distribution of rainfall reduction. a Sea surface temperature anomaly (SSTA) based on September 2015 monthly Reyn_SmithOIv2 global product (methods). Values are in degrees Celsius (°C). The figure display the regions used for calculation of the AMO25 and PDO27 indices as well as the approximate locations of the variables used for calculation of the MEI26, 44. P+ and P− represent sea-level pressure dipole, U corresponds to the zonal westerly wind anomalies in central Pacific ocean, V+ and V− correspond to the southerly and northerly meridional wind anomalies, S is the sea surface temperature and A the surface air temperature, and C indicates cloudiness anomalies. Pixel-based monthly correlations between the oceanic indices and rainfall anomalies were calculated for b MEI, c PDO and d AMO. Classes in the map with red colour shades indicate that the increased value of one oceanic index has the effect of reducing rainfall in the specific grid cell (negative correlation). Blue colour shades indicate the opposite. e Mapped grid cells with significant negative correlation coefficients (p < 0.05) between oceanic indices such as the MEI (b), PDO (c) and AMO (d) and monthly rainfall anomalies. Classes in the map indicate where the increased value of one oceanic index or their combination has the effect of reducing rainfall in the specific grid cell. All grid cells have a 0.25° spatial resolution

