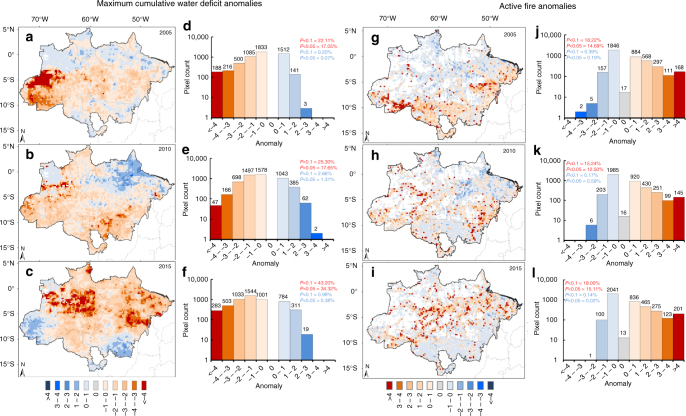
Fig. 3.
Spatial patterns of water deficit and active fire incidence in the Brazilian Amazon. Pixel-based annual anomalies (σ) of the Maximum Cumulative Water Deficit (MCWD) for 2005 (a)), 2010 (b) and 2015 (c) and the histograms showing the pixel counts for each category in the MCWD map for 2005 (d), 2010 (e) and 2015 (f). Similarly, we show maps of active fire anomalies for 2005 (g), 2010 (h) and 2015 (i) and their respective histograms (j), (k), (l). Red and blue bars indicate respectively positive and negative anomalies for fires and the opposite for the MCWD. All units are standard deviation values calculated as the departure of annual values from the 2003–2015 annual averages, excluding drought years (2005, 2010 and 2015)

