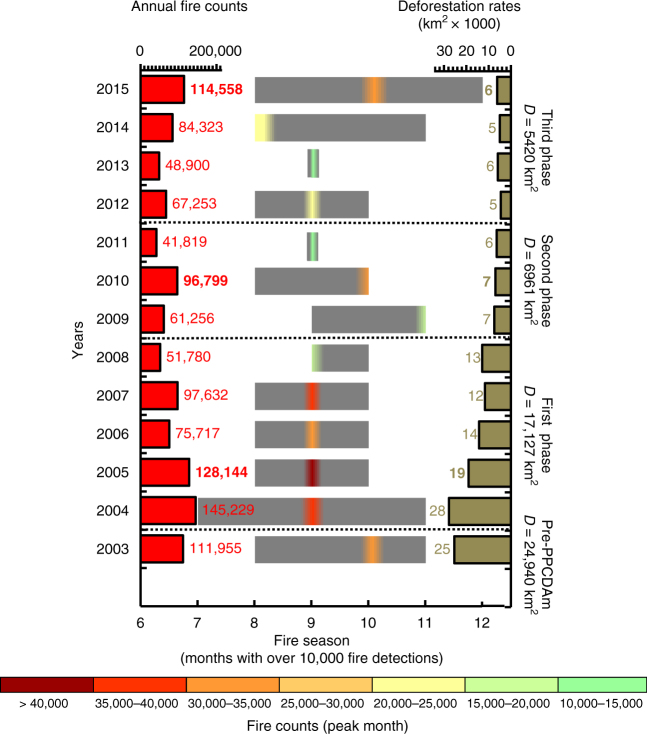
Fig. 5.
Annual fire behaviour in the Brazilian Amazon. Fire season estimated as the months with over 10,000 fire detections. Numbers in the x-axis correspond to the fire season months from June (month 6) to December (month 12). The length of the grey bars corresponds to the sum of all months with fire above the threshold. Colours inside of grey bars indicate the number of active fires detected during the peak fire month. Red bars on the left indicate the absolute number of annual fires detected and dark green bars on the right are depicting the total area deforested (km2 yr−1) for each year within the limit of the Brazilian Amazon biome. Dashed lines separate the phases of the Action Plan for Prevention and Control of Deforestation in Amazonia (PPCDAm). Numbers over the bars in bold correspond to the drought years

