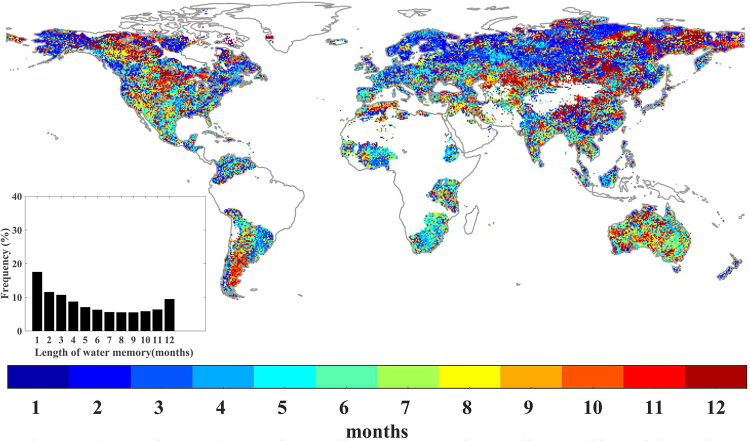
Figure 1.
Spatial distribution of the length of water memory during the growing season, from 1982 to 2012, on a monthly basis. Areas with barren land (mean NDVI < 0.1 for all months), permanent ice, and the percentage of missing values greater than 5% in the CRU TS4.01 climate datasets are not shown. The inset shows the frequency distribution of water memory length. NDVI, Normalized Difference Vegetation Index. This map was produced using MATLAB R2016b (http://www.mathworks.com/products/matlab/).

