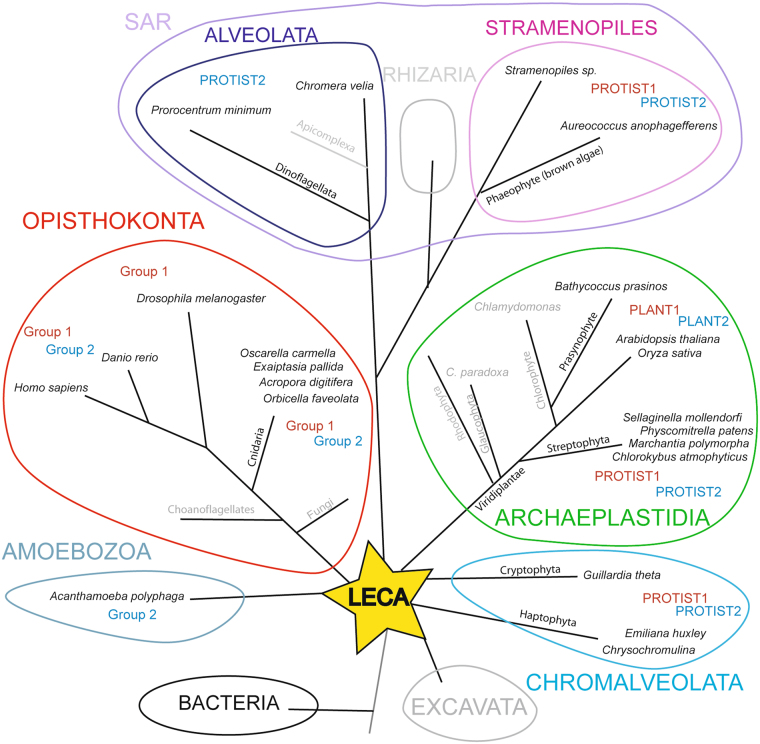
Figure 2.
Schematic phylogenetic tree showing the GT29 ST-related sequences distribution in eukaryotes. The figure was constructed using the NCBI taxonomy browser (http://www.ncbi.nlm.nih.gov/Taxonomy) and the data from47. The star-like phylogenetic tree indicates the six monophyletic groups of eukaryotes i.e. opisthokonts (red), SAR (pink), Archaeplastida (green), Hacrobia (blue) and Excavata (grey). Branches length is not drawn to scale. Those organisms showing one or more GT29 ST sequences are indicated in black whereas lineages that have lost ST sequences are indicated in grey. Affiliation of ST sequences to one phylogenetic group or the other (see Fig. 3) is indicated. Abbreviations used: LECA: Last eukaryotes common ancestor; SAR: Stramenopiles, Alveolata, Rhizaria.

