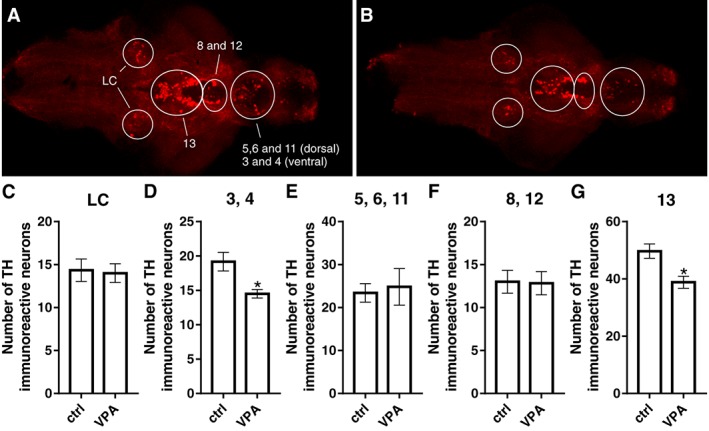
Figure 8.

TH‐immunoreactive cell populations in the brain of zebrafish larvae. TH populations were identified in control (A) and VPA‐exposed (B) larval brains, which were imaged from the ventral side. The number of cells did not differ between groups in the LC (C) and in populations 5, 6 and 11 (E) and 8 and 12 (F). VPA‐exposed larval brains presented a reduction in the number of TH1‐immuoreactive cells in populations 3 and 4 (D) and 13 (G) when compared with the control group. A representative image for each group is shown. Data are expressed as mean ± SEM; n = 6 per group. *P < 0.05, significantly different from control; Student's t‐test.
