
Figure 6.
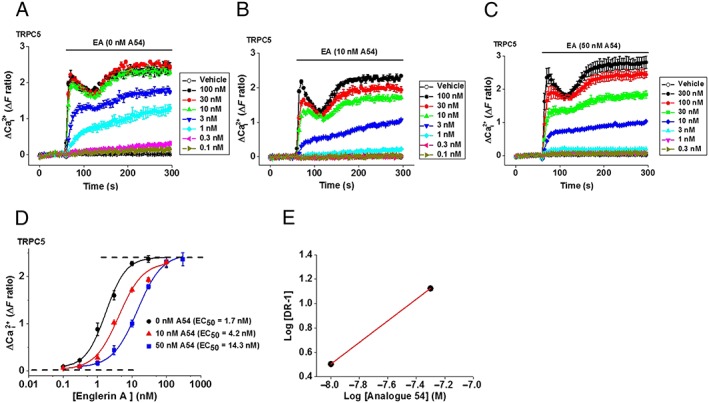
A54 causes parallel rightward shifts of the EA concentration–response curve. (A–C) Example data from HEK‐TRPC5 cells showing the concentration‐dependence of EA responses in the presence of (A) 0, (B) 10 and (C) 50 nM A54. (D) Mean ± SEM concentration–response data for experiments of the type illustrated in (A–C) (n/N = 6/24 for 0 and 50 nM and n/N = 5/16 for 10 nM). EA EC50s were 1.7 nM (0 nM A54), 4.2 nM (10 nM A54) and 14.3 nM (50 nM A54). EA slope values were 1.4 (0 nM A54), 1.3 (10 nM A54) and 1.3 (50 nM A54). (E) Schild plot regression analysis with a slope near 1 (0.9) indicating that A54 is a competitive antagonist (DR in y axis indicates the dose ratio).