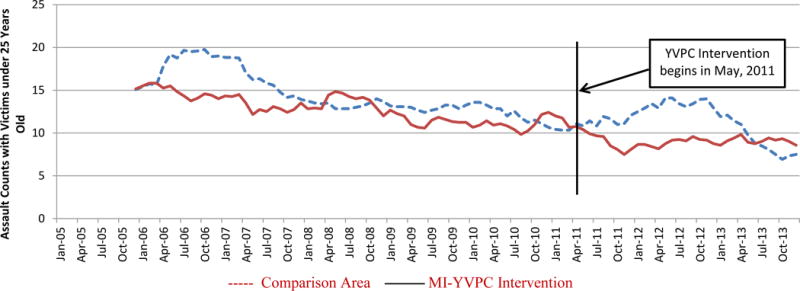
Figure 1. 12-Month Moving Average of Assault Offense Rates in Intervention and Comparison Areas.

Note: Solid line = intervention area; dashed line = comparison area. Counts from January-December 2005 not shown due to insufficient data to calculate 12-month average.
