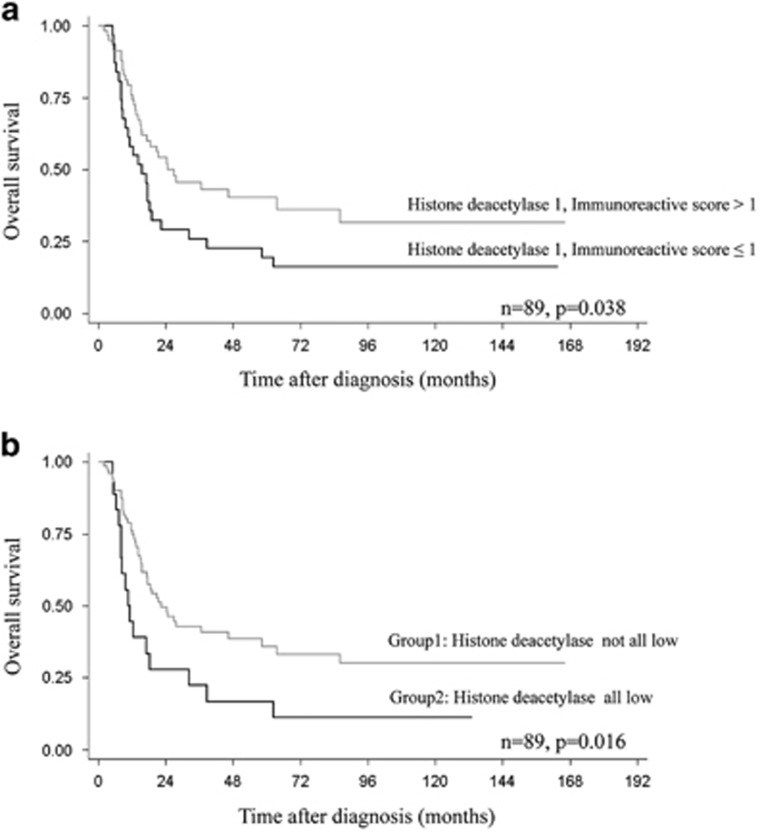
Figure 4.
Kaplan–Meier curves showing overall survival according to (a) histone deacetylase 1 expression and (b) combined histone deacetylase expression in all high-grade osteosarcoma cases; Group1—none or some histone deacetylase isoforms expressed at immunoreactive score lower than the cutoff; Group2—all-histone deacetylase isoforms expressed at immunoreactive score lower than the cutoff.

