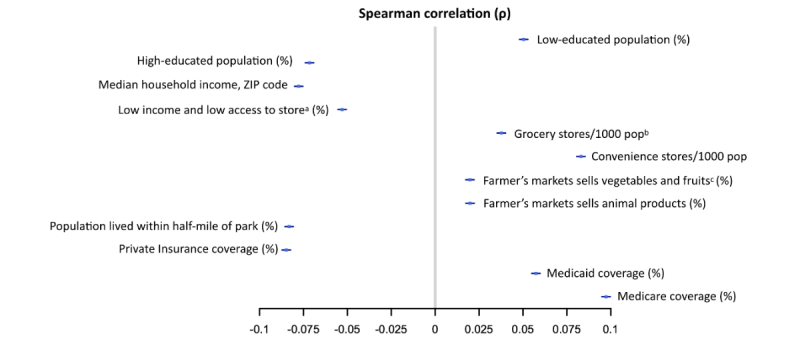
Figure 8.

Spearman rank correlation between 12 socioeconomic features and prospective hypertension risk scores. (a) Percentage of people in a county with low income and living more than 1 mile from a supermarket or large grocery store if an urban area, or more than 10 miles from a supermarket or large grocery store if a rural area. (b) The number of supermarkets and grocery stores in the county per 1000 county residents. (c) Percentage of farmers’ markets in the county that sell fresh fruits and vegetables.
