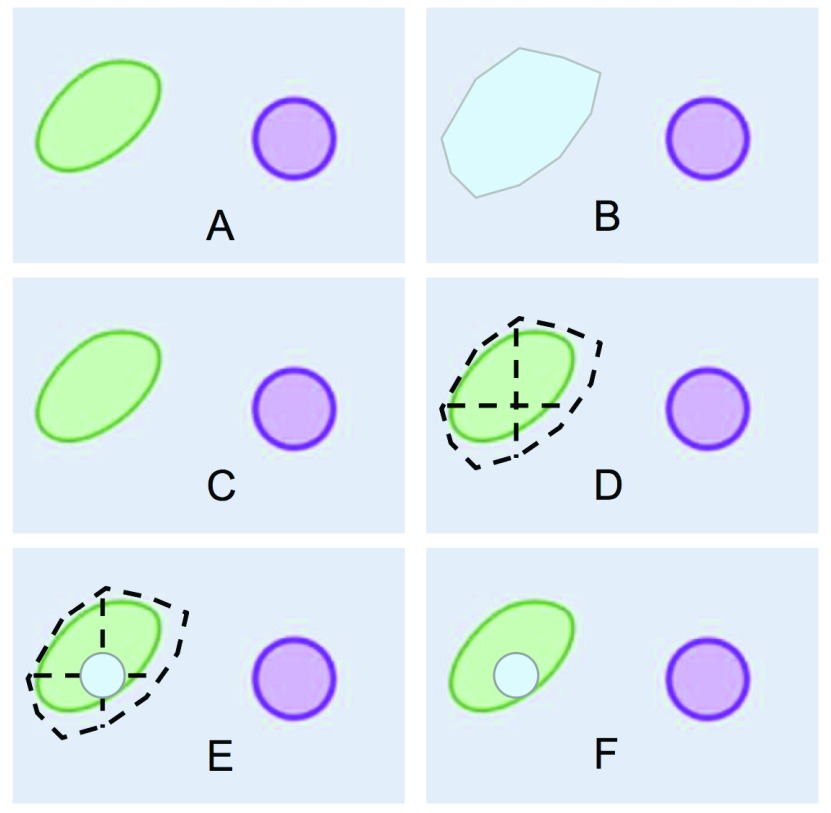
Figure 3. Definition of an area and drawing of protein circle.
( A) Section of a cartoon image of a cell; ( B) user-drawn polygon representing the area occupied by a vacuole; ( C) how the section of the cartoon image is displayed on the PPI/map viewer; ( D) random point calculation inside vacuole-polygon-defined area; ( E) drawing of a protein circle located inside the vacuole, ( F) result of loading a protein localized in the vacuole as shown by PPI/map viewer.

