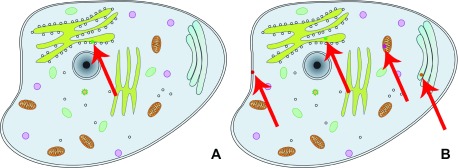
Figure 4. Comparison between PPI viewer and map viewer.
The left view ( A) shows the PPI viewer, which depicts the result of loading protein Q9NR71 and displays a circle for the first localization found in the array of locations ( http://cell.dallago.us/ppi?p=Q9NR71); The right panel ( B) shows the Map viewer, which depicts the result of loading the same protein Q9NR71 and displays a circle for the protein in each of its reported location ( http://cell.dallago.us/map?p=Q9NR71). The red arrows are overlaid on top of the screenshots to highlight where the protein circles have been drawn in the viewers, since fitting the screenshot on the page reduces the overall size of the images.

