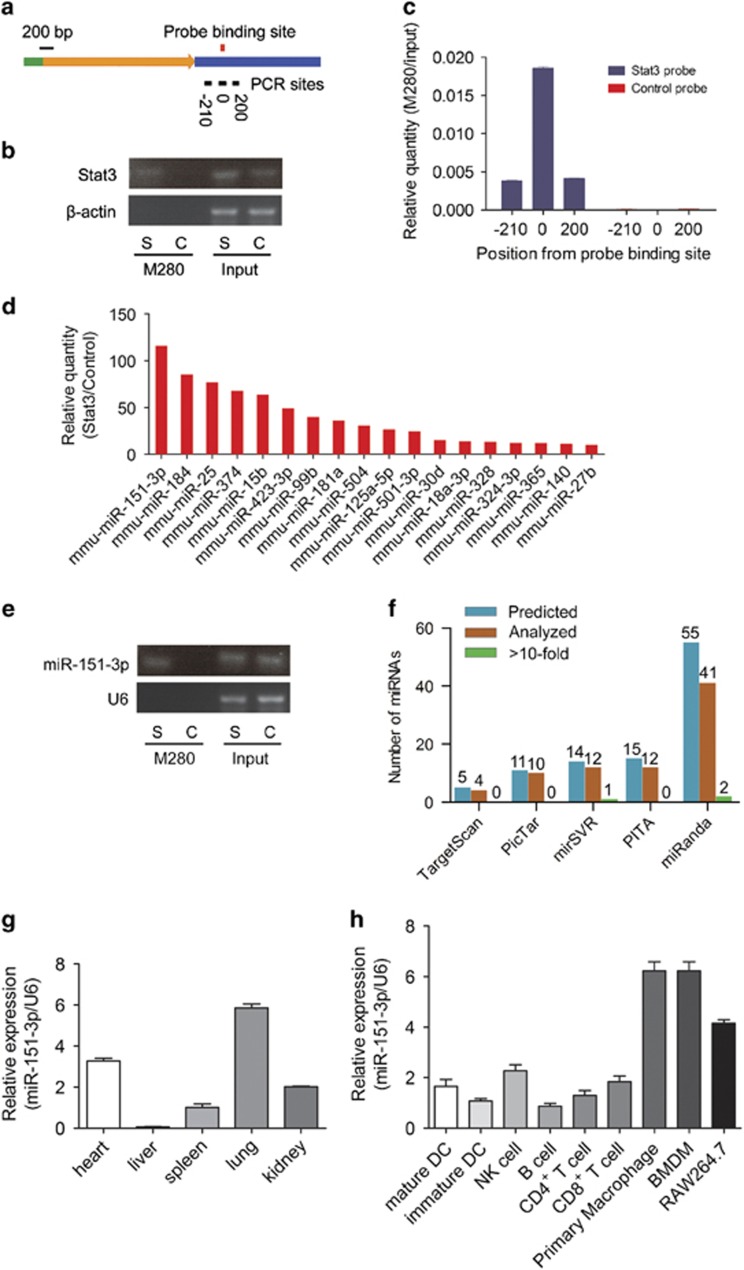
Figure 1.
Identification of miR-151-3p as an unexpected Stat3 mRNA-targeting miRNA. (a) Stat3 mRNA and probe-binding sites. The green bar, 5′-UTR; the yellow arrow, coding sequence; the blue bar, 3′-UTR; the black bars and the numbers at the bottom denote regions analyzed using RT-qPCR; red bar, the probe binding sites. (b) RT-qPCR analysis of region '0' of Stat3 mRNAs from Stat3 probe and control probe affinity purified complex in RAW264.7 cells. S, Stat3 probe; C, Control probe. (c) RT-qPCR analysis of regions of Stat3 mRNAs from Stat3 probe and control probe affinity purified complex in RAW264.7 cells. (d) Multiple miRNA array data of Stat3 probe and control probe affinity purified complex in RAW264.7 cells. The data are shown as normalized values for the enriched miRNAs (>10-fold). (e) RT-qPCR analysis of the most enriched miR-151-3p. S, Stat3 probe; C, control probe. (f) The comparisons of miRNAs identified by miRIP and predicted using TargetScan, PicTar, PITA, miRanda and mirSVR in the 500-bp region around probe-binding sites for Stat3 mRNAs. (g) The expression of miR-151-3p in different organs was measured using RT-qPCR and normalized to the expression of U6. (h) The expression of miR-151-3p in different immune cells was measured using RT-qPCR and normalized to the expression of U6. Data are shown as the means±s.d. (n=3) of one representative experiment. Similar results were obtained in at least three independent experiments.

