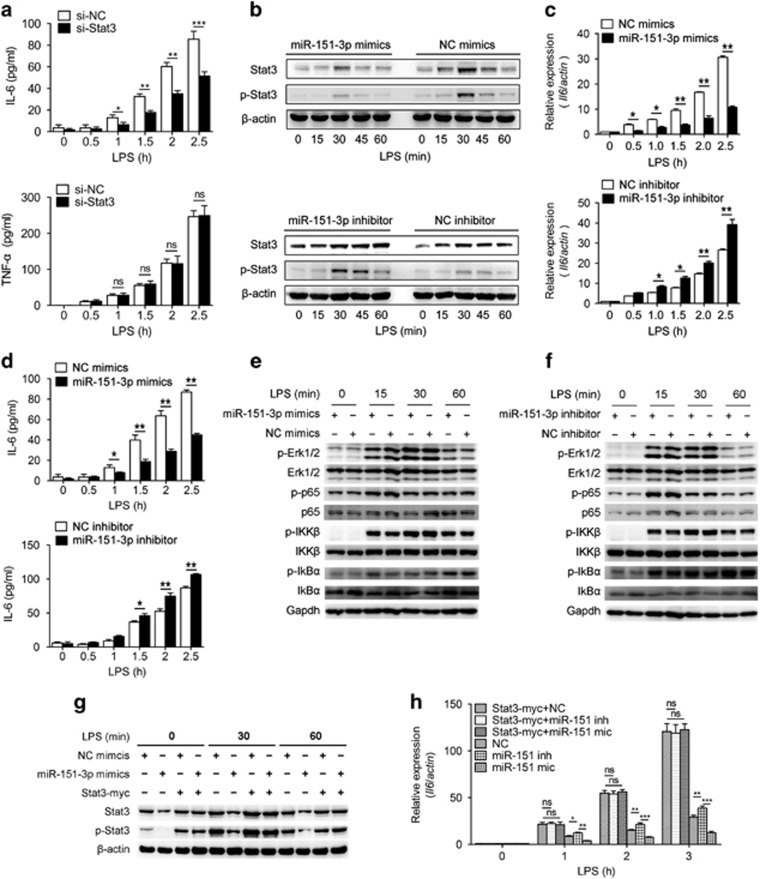
Figure 6.
miR-151-3p negatively regulates LPS-induced IL-6 production in primary macrophages by targeting Stat3. (a) Primary macrophages were transfected with Stat3 siRNA or a scrambled negative control. Quantification of IL-6 and Tnf-α in cell culture supernatant were determined using ELISA after stimulation with LPS (100 ng/ml) for the indicated time. (b) Primary macrophages were transfected with mimics or inhibitors of miR-151-3p, then stimulated with LPS (100 ng/ml) for the indicated time points. p-Stat3 and Stat3 levels were analyzed by immunoblotting. (c and d) Primary macrophages were transfected with miR-151-3p mimics or inhibitors. After 36 h, the cells were stimulated with or without LPS (100 ng/ml). IL-6 was measured at the indicated time points using RT-qPCR (c) and ELISA assay (d). (e and f) Representative immunoblot analysis of phosphorylated Erk, total Erk, phosphorylated p65, total p65, phosphorylated IKKβ, total IKKβ, phosphorylated IkBα, total IkBα and GAPDH from primary macrophages transfected with miR-151-3p mimics (e) or inhibitors (f) and then stimulated with 100 ng/ml LPS for the indicated time points. (g and h) Primary macrophages were transfected with negative control, miR-151-3p mimics, negative control plus the Stat3-myc overexpression plasmid as indicated. After 48 h, the cells were stimulated with LPS (100 ng/ml) for the indicated time points. The levels of Stat3 and p-Stat3 were analyzed by immunoblotting (g), and the levels of IL-6 mRNA were measured using RT-qPCR (h). The data are shown as the means±s.d. (n=3) of one representative experiment. Similar results were obtained in at least three independent experiments. NC, scrambled negative control oligonucleotides. *P<0.05; **P<0.01; ***P<0.001, unpaired Student's t-test.

