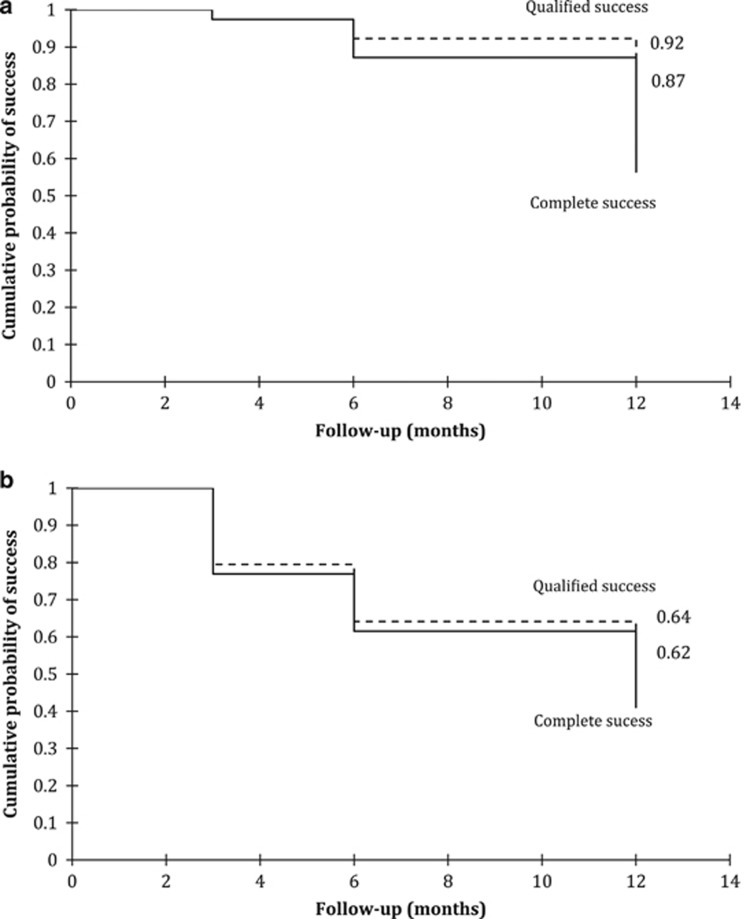
Figure 3.
Kaplan–Meier survival curve at 12 months, defining failure as (a) IOP >21 mm Hg or not reduced by 20% below baseline on two consecutive study visits, or IOP of <6 mm Hg or needing further glaucoma drainage surgery, and (b) IOP >15 mm Hg or not reduced by 30% below baseline on two consecutive study visits, or IOP of <6 mm Hg or needing further glaucoma drainage surgery.

