
Figure 3.
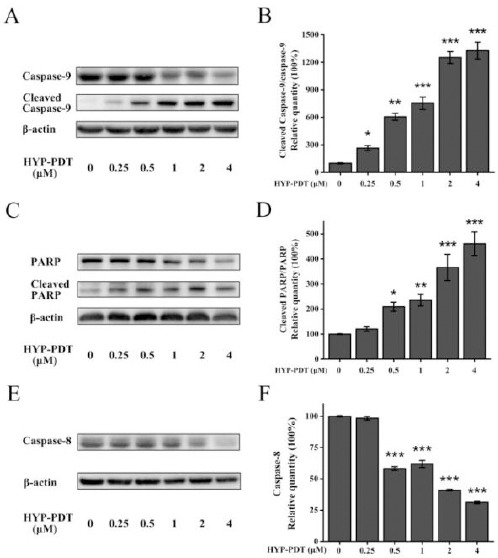
Effects of hypericin-photodynamic therapy on apoptosis pathway protein expression in MH7A cells. Cells were treated with HYP (0–4 μM) and then PDT irradiation. (A, C, E) Western blot was used to measure apoptotic proteins and β-actin was an internal control. Densitometric measurements were analyzed using ImageJ software. (B, D, F) Relative protein quantities were normalized against that of untreated cells (0 μM HYP; 100%). Graph bars represent means±SD from three independent experiments. *P<0.05, **P<0.01, ***P<0.001, compared to untreated cells (0 μM HYP)
HYP: hypericin; PDT: photodynamic therapy