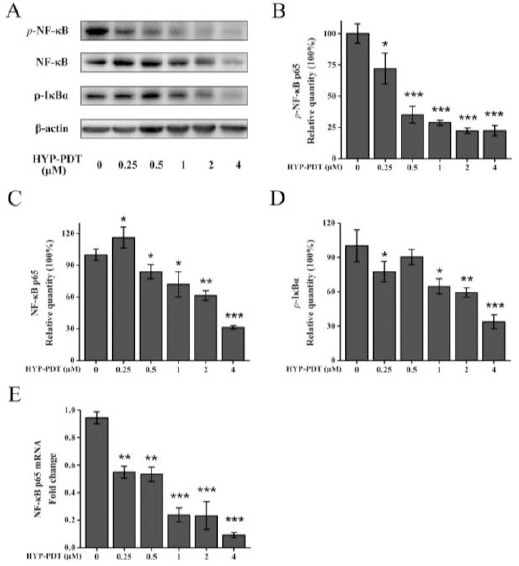
Figure 4.

Inhibitory effects of hypericin-photodynamic therapy on NF-κB activation in MH7A cells. Cells were treated with HYP (0–4 μM) and PDT. NF-κB pathway proteins and mRNA were measured with Western blot and qRT-PCR, with β-actin used as an internal control. (A) Western blot data is shown for p-NF-κB p65, NF-κB p65 and p-IκBα and densitometric analysis performed using ImageJ software. Relative quantities of p-NF-κB p65 (B), NF-κB p65 (C) and p-IκBα (D) were normalized to untreated cells (0 μM HYP; 100%). (E) NF-κB p65 mRNA was assessed using qRT-PCR. Gene expression was normalized to GAPDH. Data are means±SD (n=3); ***P<0.001, compared to untreated cells (0 μM HYP)
HYP: hypericin; PDT: photodynamic therapy
