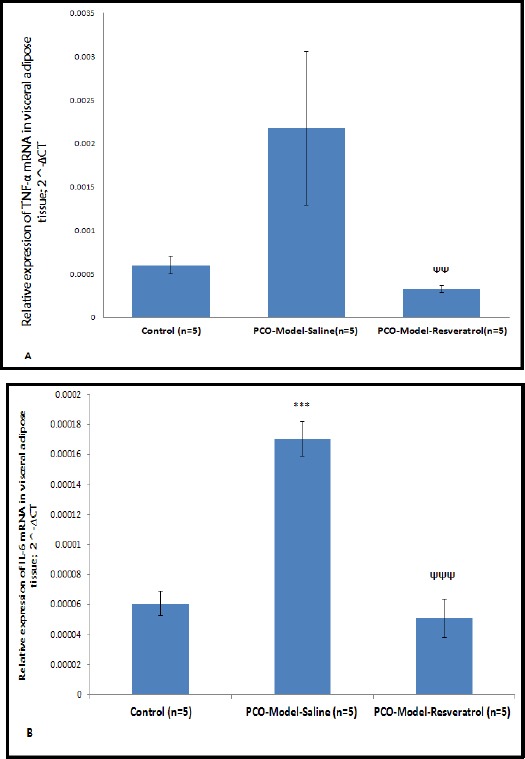
Figure 3.

The relative expression levels of Tnf-α (A) and Il-6 (B) mRNAs in the visceral adipose tissue of three groups. The expression values were normalized to β-actin and were compared using the 2^-ΔCT method. The data are represented as means for 5 animals per group with the standard errors of the means. Statistics were by one-way ANOVA followed by the Tukey’s post hoc test. P-values less than 0.05 were considered statistically significant. ΨΨ: P<0.01 vs. the PCO-model-saline group. ***: P<0.001 vs. the control group; ΨΨΨ: P<0.001 vs. the PCO-model-saline group
