
Figure 2. Autophagy blockade selectively impairs the IFN-I response to live avirulent Gram-positive bacteria.
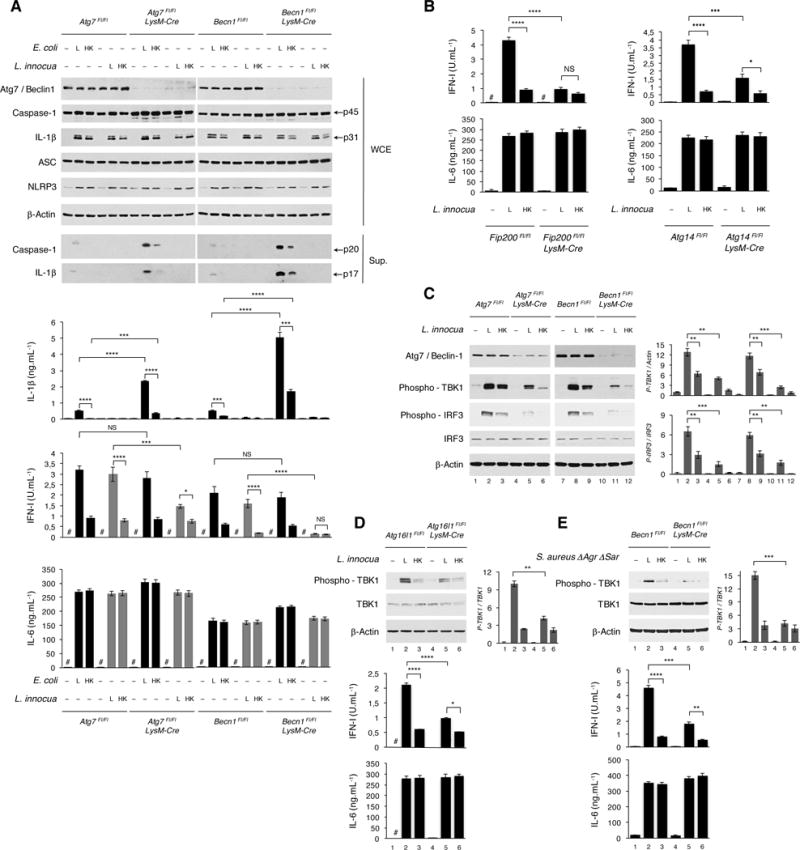
(A) WB on WCE and culture supernatants (sup) from BMDM of indicated genotypes 6 hr (WCE) or 20 hr (sup) post indicated stimuli probed for the proteins indicated (left). Cytokine production (bar graphs) 20 hr post indicated stimuli. Black bars, E. coli. Grey bars, L. innocua.
(B) Cytokine production by BMDM of indicated genotypes 20 hr post indicated stimuli.
(C) WB on BMDM of indicated genotypes 6 hr post indicated stimuli.
(D and E) WB on BMDM of indicated genotypes 6 hr post indicated stimuli. Cytokine production at 20 hr.
In C-E, bar graphs to the right of WB panels show quantification of indicated signals. Cytokine levels measured as in Figure 1A. Error bars, mean ± s.e.m. *P≤0.05, **P≤0.01, ***P≤0.001, ****P≤0.0001, NS = non-significant, Student’s t-test, combining results from 3 independent experiments. # = not detected.