
Figure 3. Live but not dead Gram-positive bacteria inactivate mTORC1 to promote autophagy and IFN-I production.
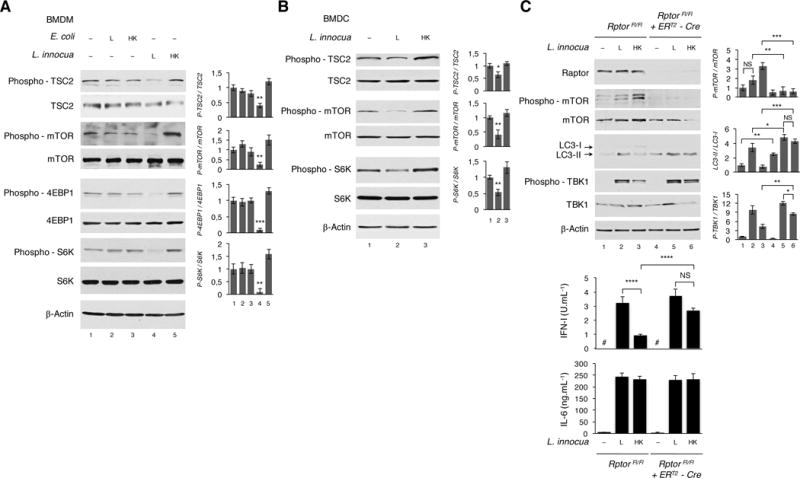
(A and B) WB on BMDM (A) or BMDC (B) 6 hr post indicated stimuli.
(C)RptorFL⁄FL or RptorFL⁄FL ERT2-UbC-Cre BMDM treated with Tamoxifen for 72 hr to induce Cre recombination for Rptor deletion. WB 6 hr and cytokine production 20 hr post indicated stimuli. Cytokine levels measured as in Figure 1A.
WB probed for proteins indicated on left of panels. Bar graphs to right of WB panels show quantification of indicated signals. Error bars, mean ± s.e.m. *P≤0.05, **P≤0.01, ***P≤0.001, ****P≤0.0001, NS = non-significant, Student’s t-test, combining results from 3 independent experiments. # = not detected.